


 22 / 133

14
are mainly shipped to developed countries in recent years.
The top ten countries accounts for 54.5 per cent of extra-OIC
exports. This points to a high country concentration in total
OIC exports which makes OIC countries vulnerable to external
shocks that might result from decreasing demand in these
countries and/or falling commodity prices. Appendix Table
A4 which provides the top three destinations for each OIC member state reveals that the top
three destinations constitutes around half or above half of exports in thirty member states. This
again points to dependence on a few markets for exports and underscores the case for policies
aimed to broaden export markets.
Table 3: Major Destinations of Total Extra-OIC Exports
Countries
(Billion Dollars)
Share %
2015
2016
2017
2015
2016
2017
China
165.3
145.7
181.5
10.9
10.6
11.3
India
123.0
107.2
129.7
8.1
7.8
8.1
United States
96.7
96.7
110.5
6.3
7.1
6.9
Japan
129.4
101.2
109.0
8.5
7.4
6.8
Korea
83.4
68.6
81.4
5.5
5.0
5.1
Singapore
69.2
63.7
76.1
4.5
4.6
4.8
Italy
48.9
46.4
58.2
3.2
3.4
3.6
France
38.5
35.4
43.1
2.5
2.6
2.7
Netherlands
39.0
31.5
42.8
2.6
2.3
2.7
Germany
36.3
35.9
40.1
2.4
2.6
2.5
Total of Top Ten Countries
829.7
732.2
872.4
54.5
53.4
54.5
Total OIC Export
1,523.0
1,370.6
1,602.2
100.0
100.0
100.0
Source: IMF Direction of Trade Statistics
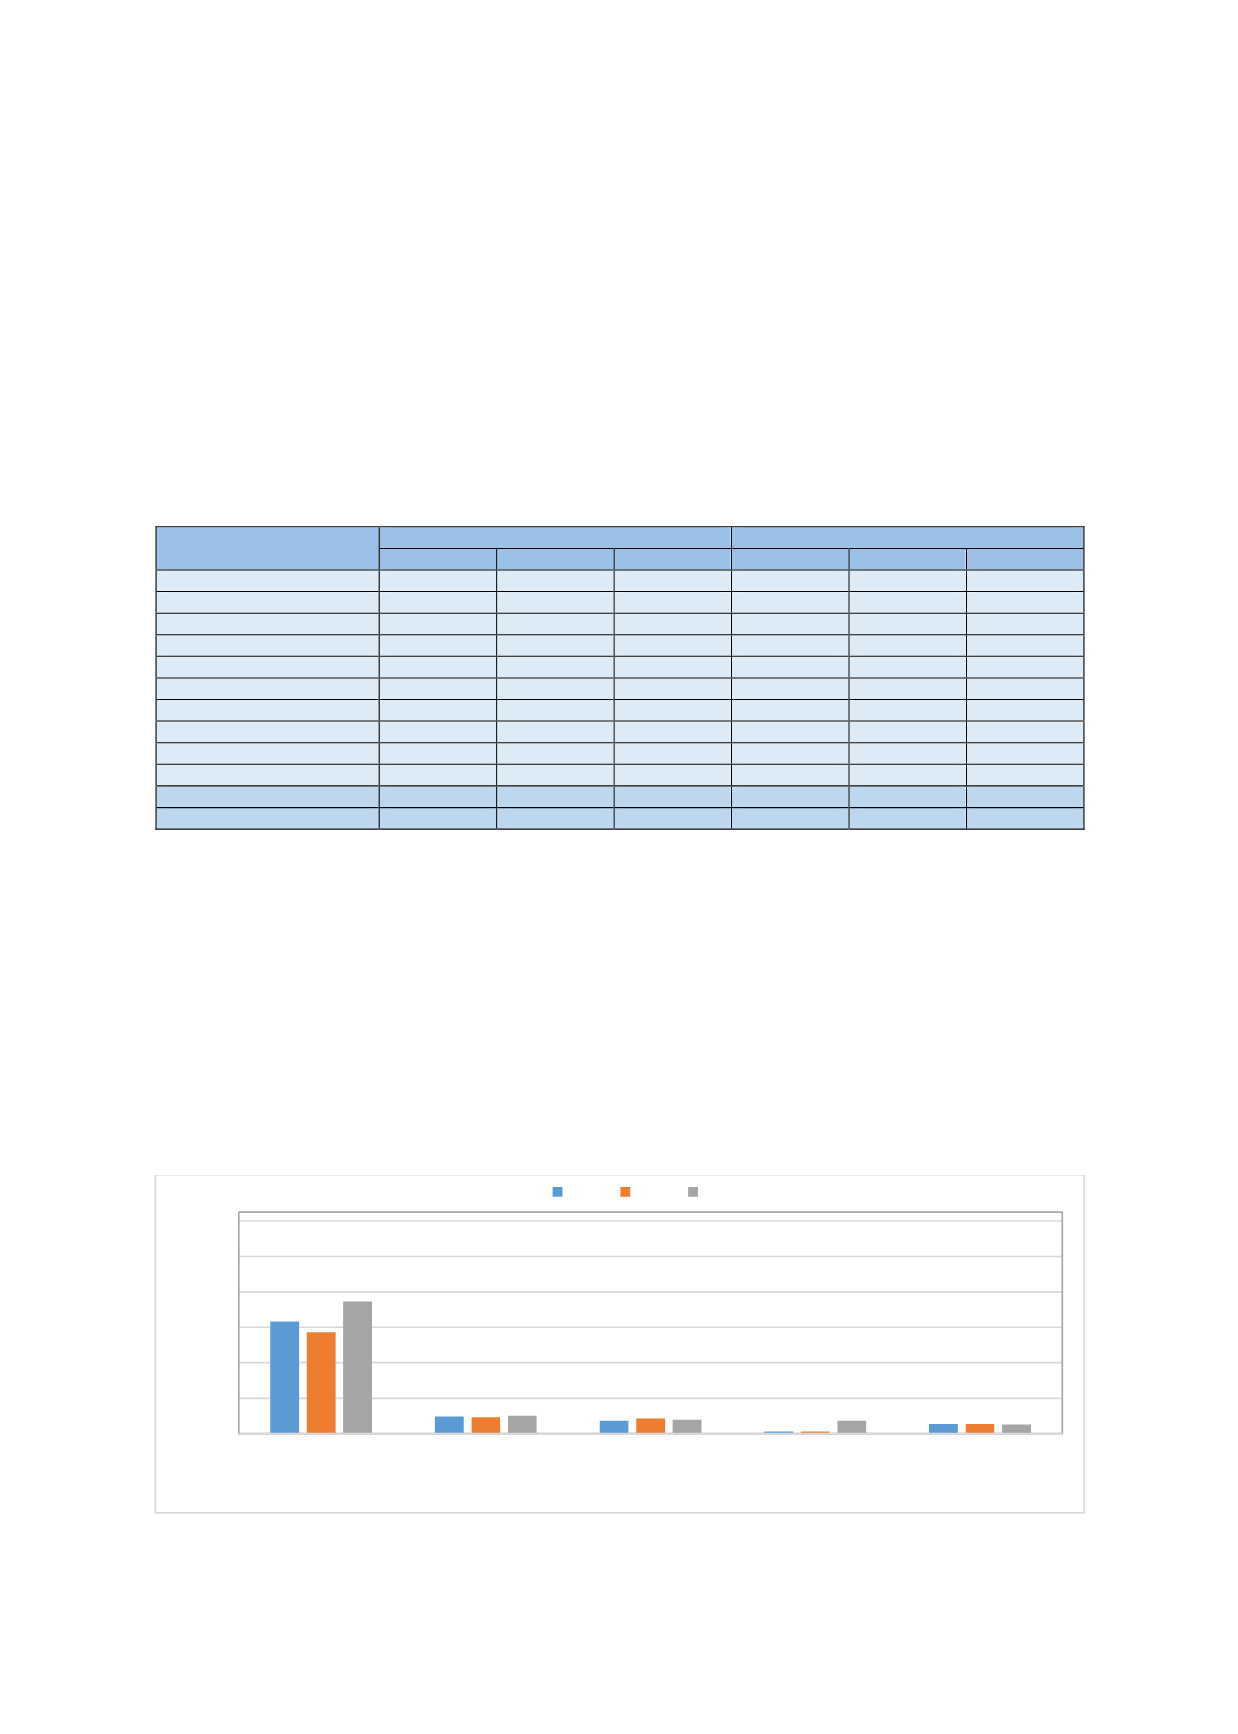
Product concentration of total OIC exports is very high.
Share of mineral fuels, oils and distillation products in total
OIC exports was 60.2 in 2011. Although mineral fuels, oils
and distillation products has still the highest share in total
OIC exports, its share was down by 18.1 percentage points
between 2011 and 2016 due to collapse in oil prices. However the share of mineral fuels and
oils in total OIC exports increased to 45.0 per cent in 2017 due to the rise in oil prices. This sector
was followed by electrical machinery and equipment, pearls, precious stones, ores, slag and ash
and machinery, mechanical appliances. These five sectors as a whole accounted for 63.2 per cent
of total OIC exports in 2017.
Figure 15: Evolution of OIC Exports to World- Top 5 Items
Source: ITC Trade map
0
200
400
600
800
1000
1200
Mineral fuels, mineral oils
etc.
Electrical machinery and
equipment and parts
thereof etc.
Natural or cultured pearls,
precious or semi-precious
stones etc.
Ores, slag and ash Machinery, mechanical
appliances, nuclear
reactors etc.
Billion Dollars
2015 2016 2017
“The country
concentration of total
OIC exports is high”
“OIC exports are
dominated by mineral
fuels and oils”