


 20 / 133

12
Figure 12: Share of OIC in Global Trade
Source: IMF Direction of Trade Statistics
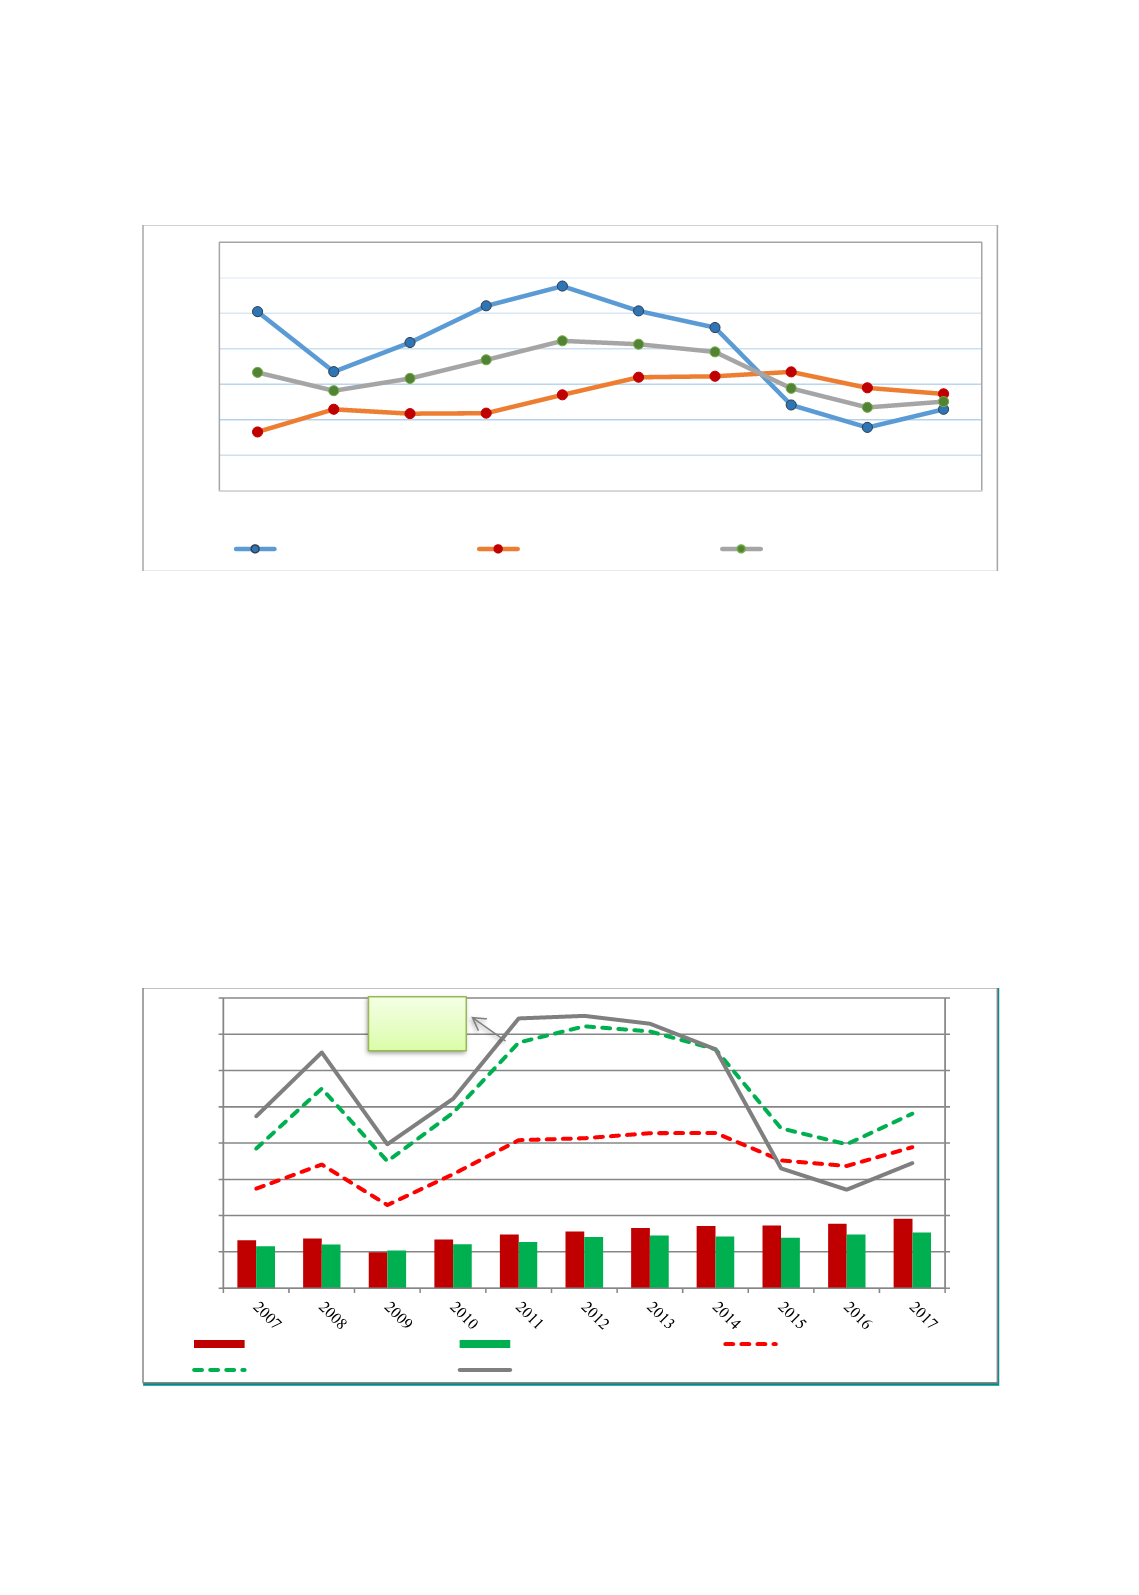
Figure 13 below demonstrates evolution of the value
versus volume (i.e. eliminating the effects of prices and
exchange rates) developments in total OIC and world
exports. In value terms (i.e. in US dollars), OIC exports
yielded higher growth rates than that of world exports
which was more prominent during the oil price boom
period between 2003 and 2012. Total OIC exports
move closely with oil prices due to heavy dominance of oil in OIC exports. As a result, OIC exports
in dollars have been on a declining trend mainly due to the recent slump in oil prices over the
last four years. On the other hand total OIC exports in volume terms (i.e eliminating the effects
of prices and exchange rates) which increased by 3.4 per cent in 2016 increased further by 1.8
per cent in 2017. The slight increase in OIC export volume indicated that themost of the increase
in total OIC exports was driven by rising export prices in 2017. It should also be noted that oil
production curbs in some oil exporters of OIC limited quantity exported.
Figure 13: Export Value versus Export Volume Indices for the World and the OIC
Source: IMF, UNCTADSTAT
7
8
9
10
11
12
13
14
2008 2009 2010 2011 2012 2013 2014 2015 2016 2017
per cent
OIC Exports / World Exports
OIC Imports / World Imports
OIC Trade / World Trade
20
70
120
170
220
270
320
370
420
80
130
180
230
280
330
380
430
480
Brent oil price index
2000: 100 Index
World Export Volume Index
OIC Export Volume Index
World Export Value Index
OIC Export Value Index
Brent oil prices index
Brent Oil
Price Index
“Most of the increase in
total OIC exports was
driven by rising export
prices in 2017”