


 21 / 133

COMCEC Trade Outlook 2018
13
Table 2 illustrates that OPEC countries oil production decreased by 0.4 percent in 2017. Saudi
Arabia, UAE, Kuwait, Qatar, Algeria and Oman were among the major oil exporting OIC countries
that decreased their oil production in 2017 compared to the previous year.
Table 2: Oil Production thousand barrels daily
Thousand barrels
daily
2010
2011
2012
2013
2014
2015
2016
2017
Growth
Rate
Annual
(%)
2017
Share
(%)
2017
Saudi Arabia
10075
11144
11635
11393
11505
11994
12402
11951
-3,6%
12,9%
Iran
4430
4472
3820
3617
3724
3862
4602
4982
8,2%
5,4%
Iraq
2469
2773
3079
3103
3239
3986
4423
4520
2,2%
4,9%
United Arab Emirates
2915
3285
3430
3543
3599
3873
4020
3935
-2,1%
4,2%
Kuwait
2560
2913
3169
3129
3101
3065
3145
3025
-3,8%
3,3%
Nigeria
2534
2463
2413
2280
2278
2204
1903
1988
4,5%
2,1%
Qatar
1638
1834
1939
2002
1985
1958
1970
1916
-2,7%
2,1%
Kazakhstan
1676
1684
1664
1737
1710
1695
1655
1835
10,8%
2,0%
Algeria
1689
1642
1537
1485
1589
1558
1577
1540
-2,3%
1,7%
Oman
865
885
918
942
943
981
1004
971
-3,4%
1,0%
Total World
83325 84027 86229 86570 88721 91547 92023 92649
0,7% 100,0%
OPEC
35665
36478
38034
37004
36945
38362
39601
39436
-0,4%
42,6%
Non-OPEC
47660
47549
48195
49565
51775
53186
52422
53213
1,5%
57,4%
memo item:
US
7549
7859
8904
10071
11768
12750
12366
13057
5,6%
14,1%
Russian Federation
10383
10538
10660
10809
10860
11009
11269
11257
-0,1%
12,2%
Canada
3332
3515
3740
4000
4271
4389
4470
4831
8,1%
5,2%
Source: Reproduced from BP Statistical Review of World Energy 2018
Note: Includes crude oil, shale oil, oil sands and natural gas liquids.
2.1. Main Characteristics of Total OIC Merchandise Exports
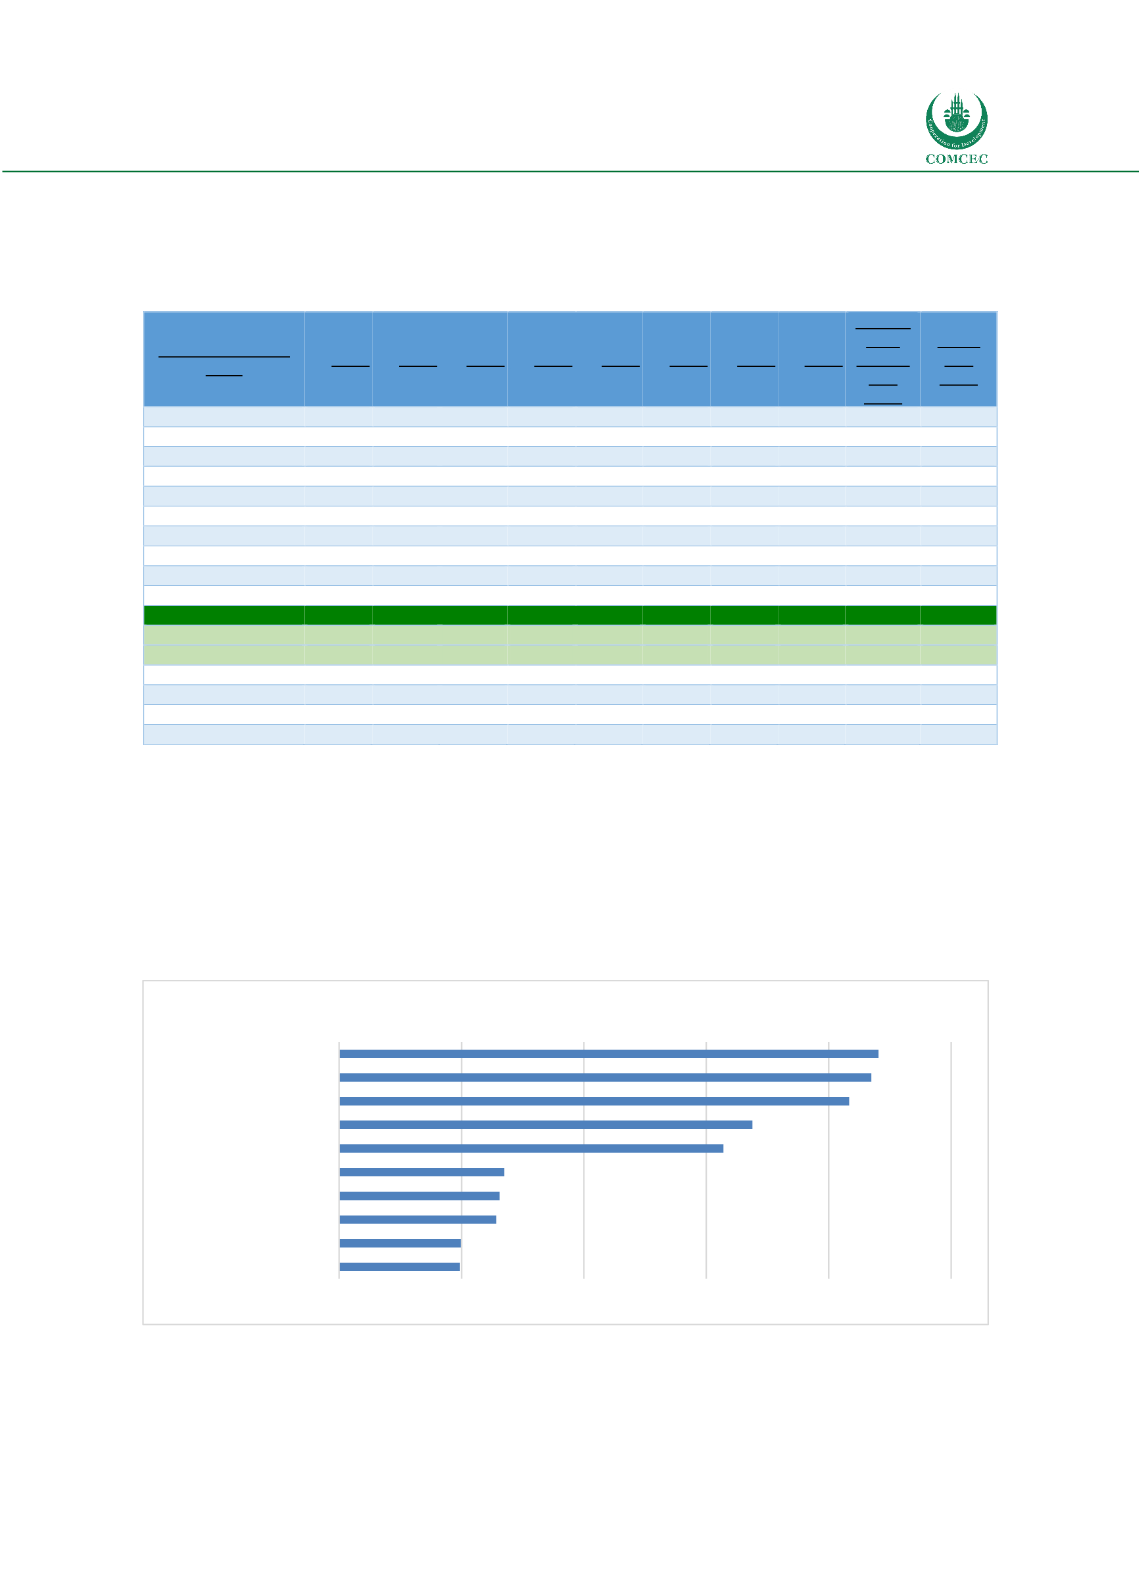
The top performers in total OIC exports were Saudi Arabia, Malaysia, United Arab Emirates,
Indonesia, Turkey, Qatar and Iran which together accounted for 67.8 per cent of total OIC
exports in 2017.
Figure 14: OIC Exports to World (Top Exporters, 2017)
Source: IMF Direction of Trade Statistics
The OIC export markets are highly concentrated (Table 3). China is the top export destination
with 11.3 per cent of extra-OIC exports destined to China in 2017. Apart from China OIC exports
49
50
64
66
67
157
169
208
217
220
0
50
100
150
200
250
Nigeria
Kuwait
Iraq
Iran
Qatar
Turkey
Indonesia
United Arab Emirates
Malaysia
Saudi Arabia
Billion Dollars