


 18 / 133

10
prices have been on an increasing trend since August 2017 due to the revival of global economic
activity, OPEC agreement to cut oil production and geopolitical instability in the Middle East.
10
OPEC and non-OPEC oil exporters including Azerbaijan, Kazakhstan and Russian Federation
agreed to curb oil production from January 2017 to March 2018 to 1.8 million barrels per day.
11
They had further agreed to extend these cuts until the end of 2018. Thus, oil prices which
averaged to 52.8 dollars per barrel in 2017 recovered strongly to 73 dollars per barrel in May
2018 which was the highest price since December 2014. However, oil prices are still well below
their peak levels of 118 dollars achieved in March 2012.
Figure 9: Monthly Oil Prices (nominal)
Source: World Bank Commodity Prices database Note: Average of Brent, Dubai and WTI.
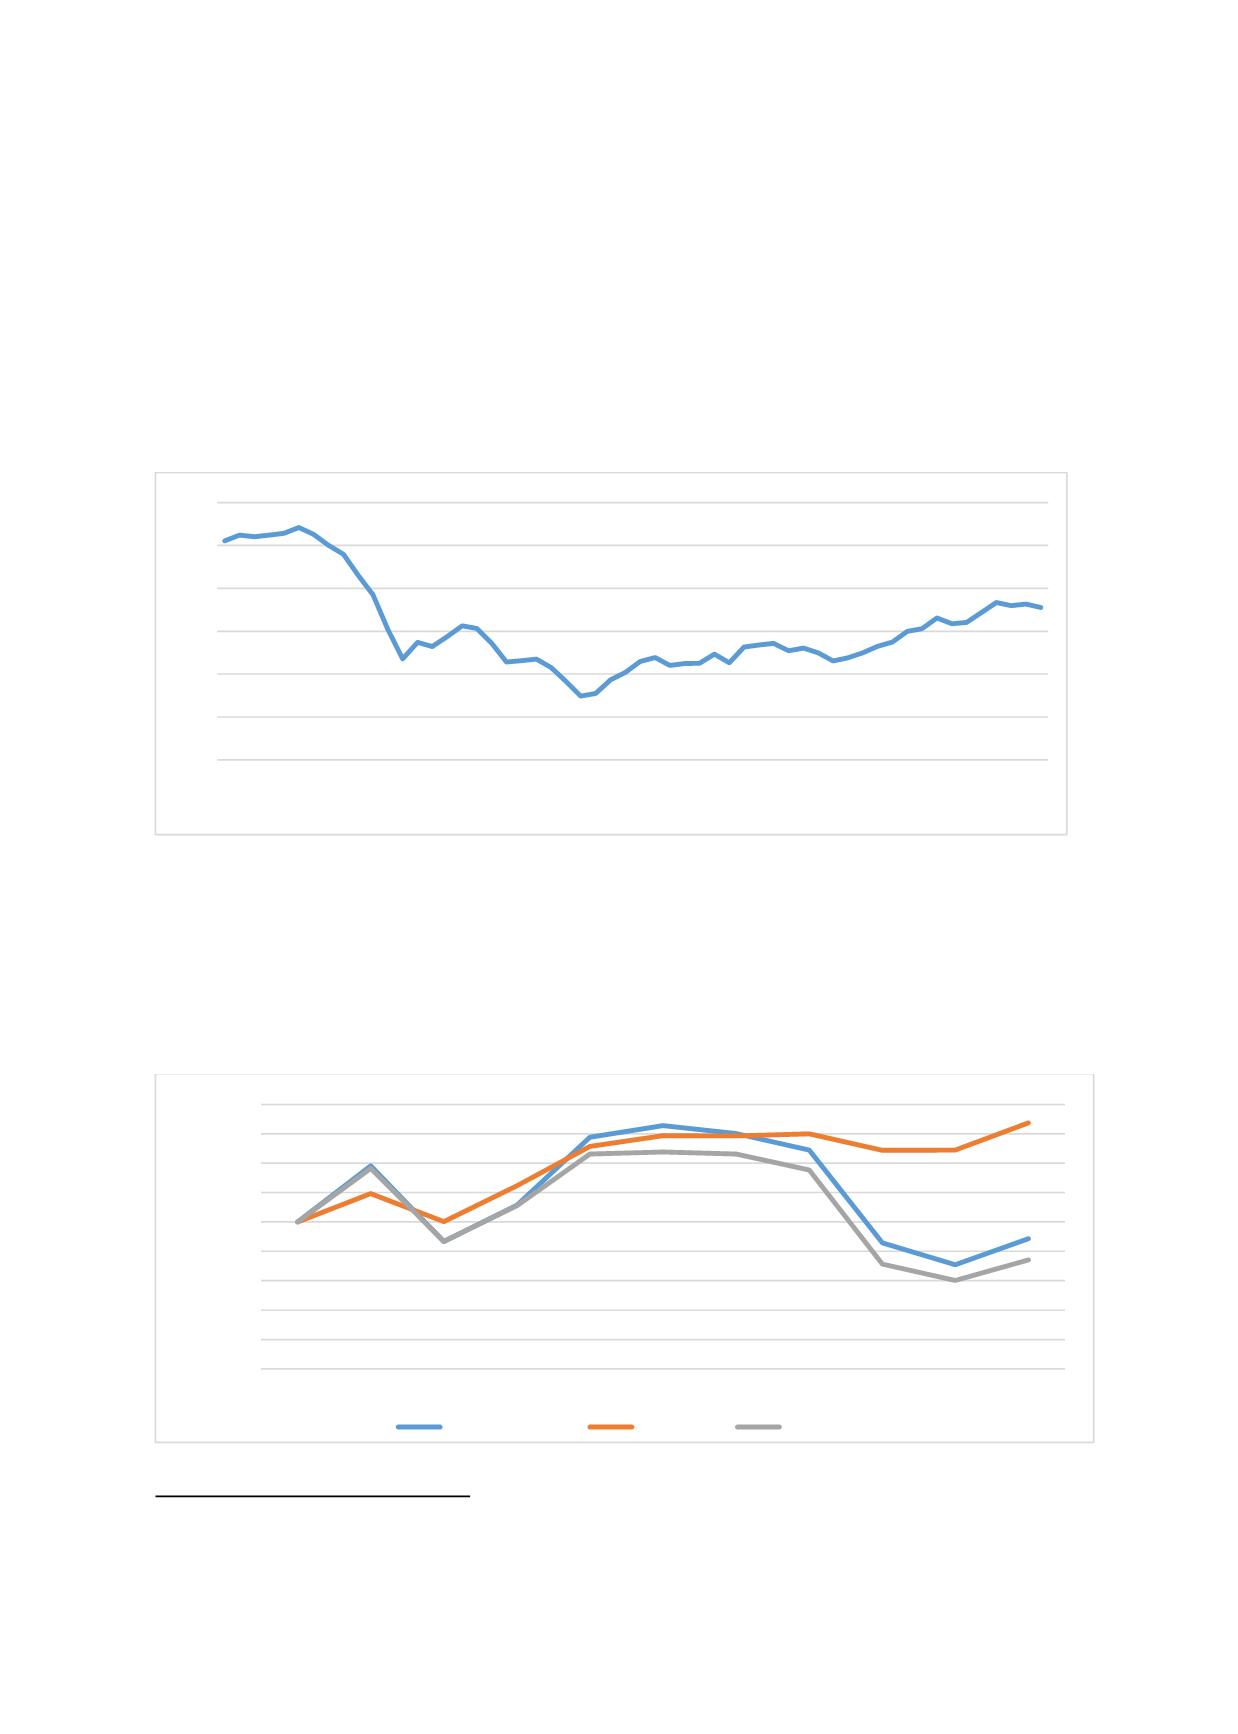
Figure 10 shows the evolution of total OIC fuels and non-fuels exports versus oil price
developments. Fuels exports are highly volatile depending on the oil price movements. As a
result, OIC fuels exports contracted severely in 2015 following the oil price collapse but bounced
back in 2017 as oil prices increased. However it should be noted that OIC fuels exports in 2017
are almost half of their levels in 2012. Meantime, OIC non fuels exports increased in 2017 as the
global activity increases.
Figure 10: Evolution of OIC Fuels and Non-Fuels Exports versus Oil Prices
Source: UNCTAD STAT database
10
IMF WEO Update January 2018
11
UN World Economic Situation and Prospects, 2018
102
108
86
61
55
63
47
30
48
54
46
55
66 69 71
0
20
40
60
80
100
120
2014M1
2014M3
2014M5
2014M7
2014M9
2014M11
2015M1
2015M3
2015M5
2015M7
2015M9
2015M11
2016M1
2016M3
2016M5
2016M7
2016M9
2016M11
2017M1
2017M3
2017M5
2017M7
2017M9
2017M11
2018M01
2018M03
2018M05
2018M07
USD per barrel
0
20
40
60
80
100
120
140
160
180
2007 2008 2009 2010 2011 2012 2013 2014 2015 2016 2017
2007: 100 Index
Fuels (SITC 3)
Non Fuel
Oil Prices