


 29 / 133

COMCEC Trade Outlook 2018
21
3.
INTRA-OIC MERCHANDISE TRADE
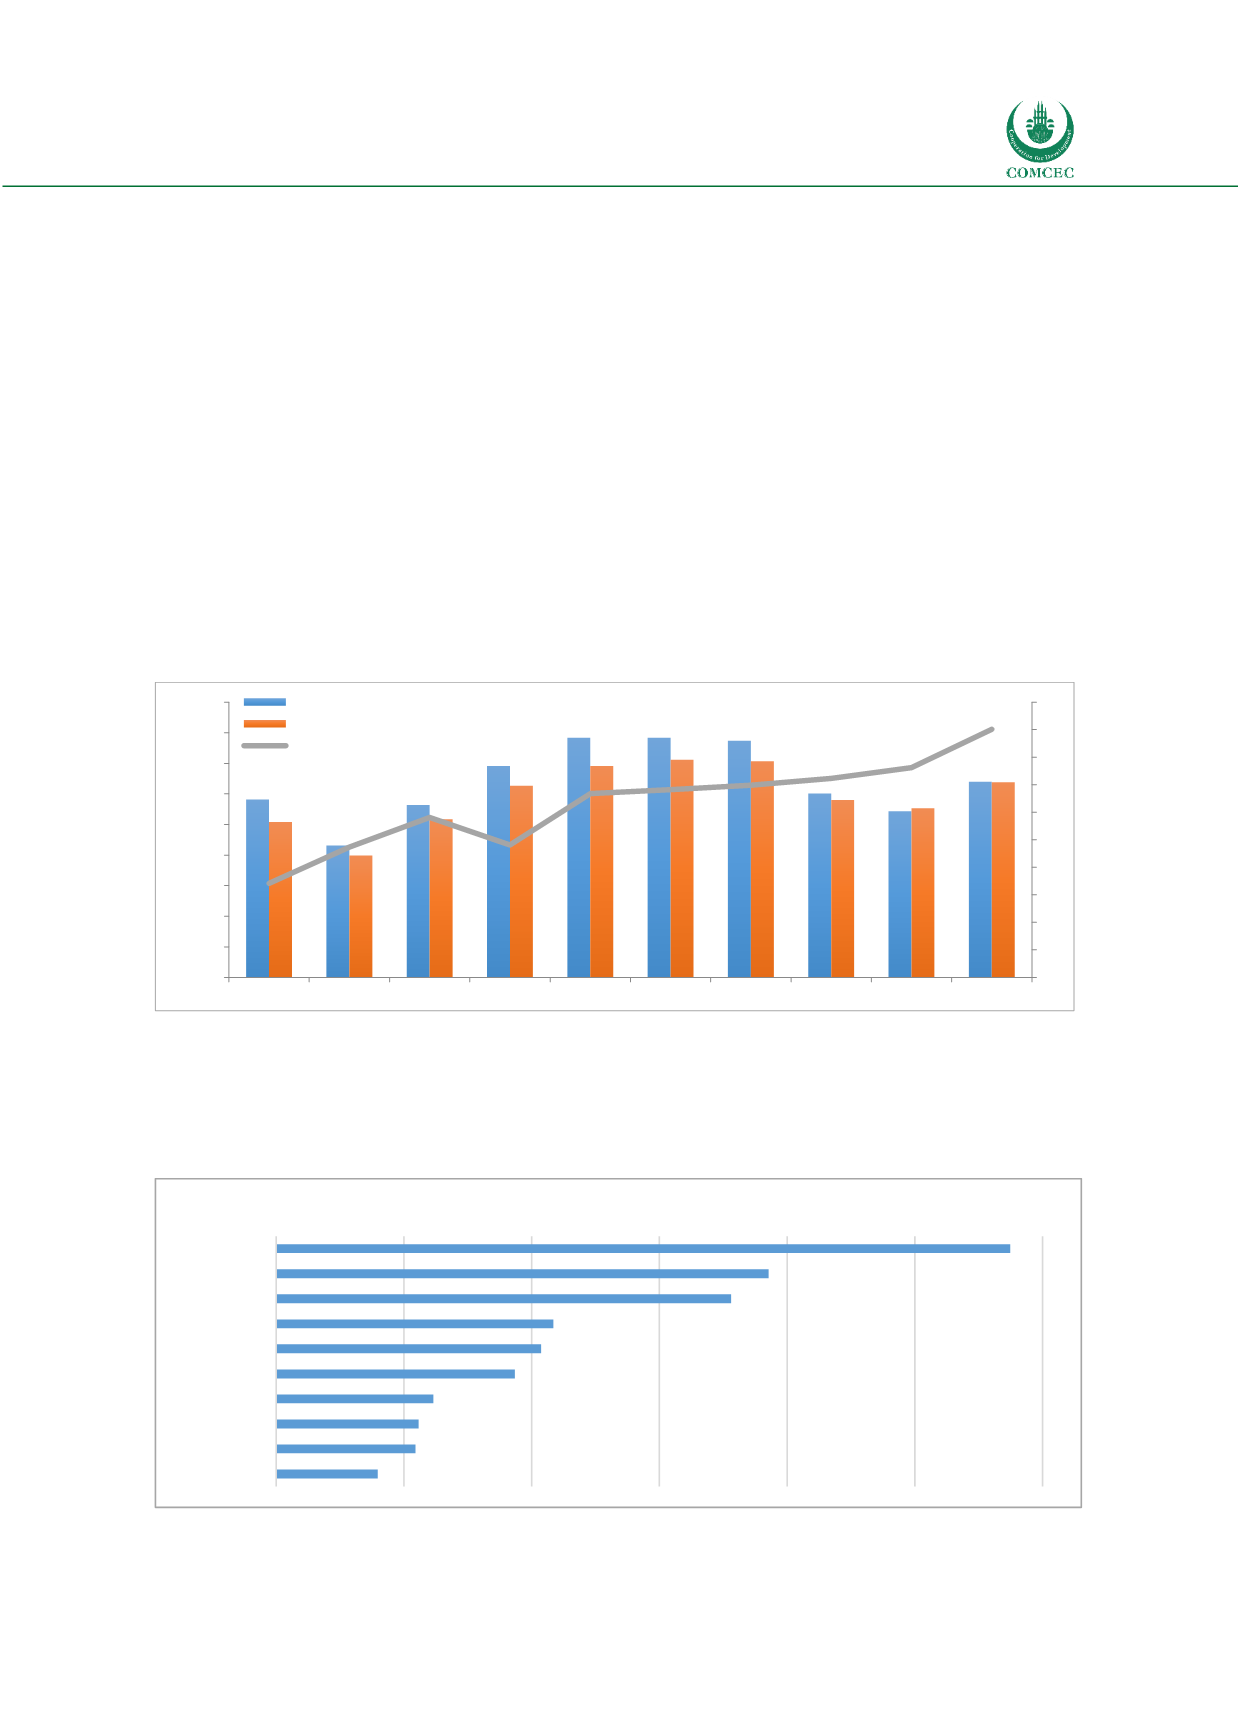
Although the intra-OIC trade (average of intra-OIC exports
and intra-OIC imports) remained weak in the last two
years, it rebounded strongly in 2017. Intra-OIC trade
increased by 16.5 per cent to 319.4 billion dollars in 2017
up from 274.1 billion dollars in 2016. It should be noted
however that intra-OIC trade is still 54 billion dollars below
its peak levels achieved in 2013.
At the 13th Islamic Summit held in April 2016, in Istanbul/Turkey, the OIC 2025: Programme of
Action was adopted. According to the Programme, it was aimed to achieve 25 per cent of intra-
OIC trade share in the total OIC trade by 2025.
The share of intra-OIC trade in total trade peaked at 19.0 per cent in 2017. Intra-OIC exports
accounted for 19.6 percent of total OIC exports while intra OIC imports accounted for 18.4
percent of total OIC imports.
Figure 24: Evolution of the Intra-OIC Trade
Source: IMF Direction of Trade Statistics
Among the leading countries in intra-OIC trade in 2017, United Arab Emirates ranked first and
followed by Turkey, Saudi Arabia, Indonesia and Malaysia. Top ten countries accounted for the
73.6 per cent of the intra-OIC trade.
Figure 25: Major Players in Intra-OIC Trade in 2017
Source: IMF Direction of Trade Statistics
15
15
16
16
17
17
18
18
19
19
20
0
50
100
150
200
250
300
350
400
450
2008
2009
2010
2011
2012
2013
2014
2015
2016
2017
Billion $
Intra-OIC Merchandise Exports (Left Axis)
Intra-OIC Merchandise Imports (Left Axis)
Intra-OIC Trade Volume/Total Trade Volume (%)
0
20
40
60
80
100
120
UAE
Turkey
Saudi Arabia
Indonesia
Malaysia
Iran
Pakistan
Oman
Egypt
Iraq
Billion Dollars
“Share of intra-OIC
trade in total OIC trade
peaked at 19.0 per cent
in 2017”