
18
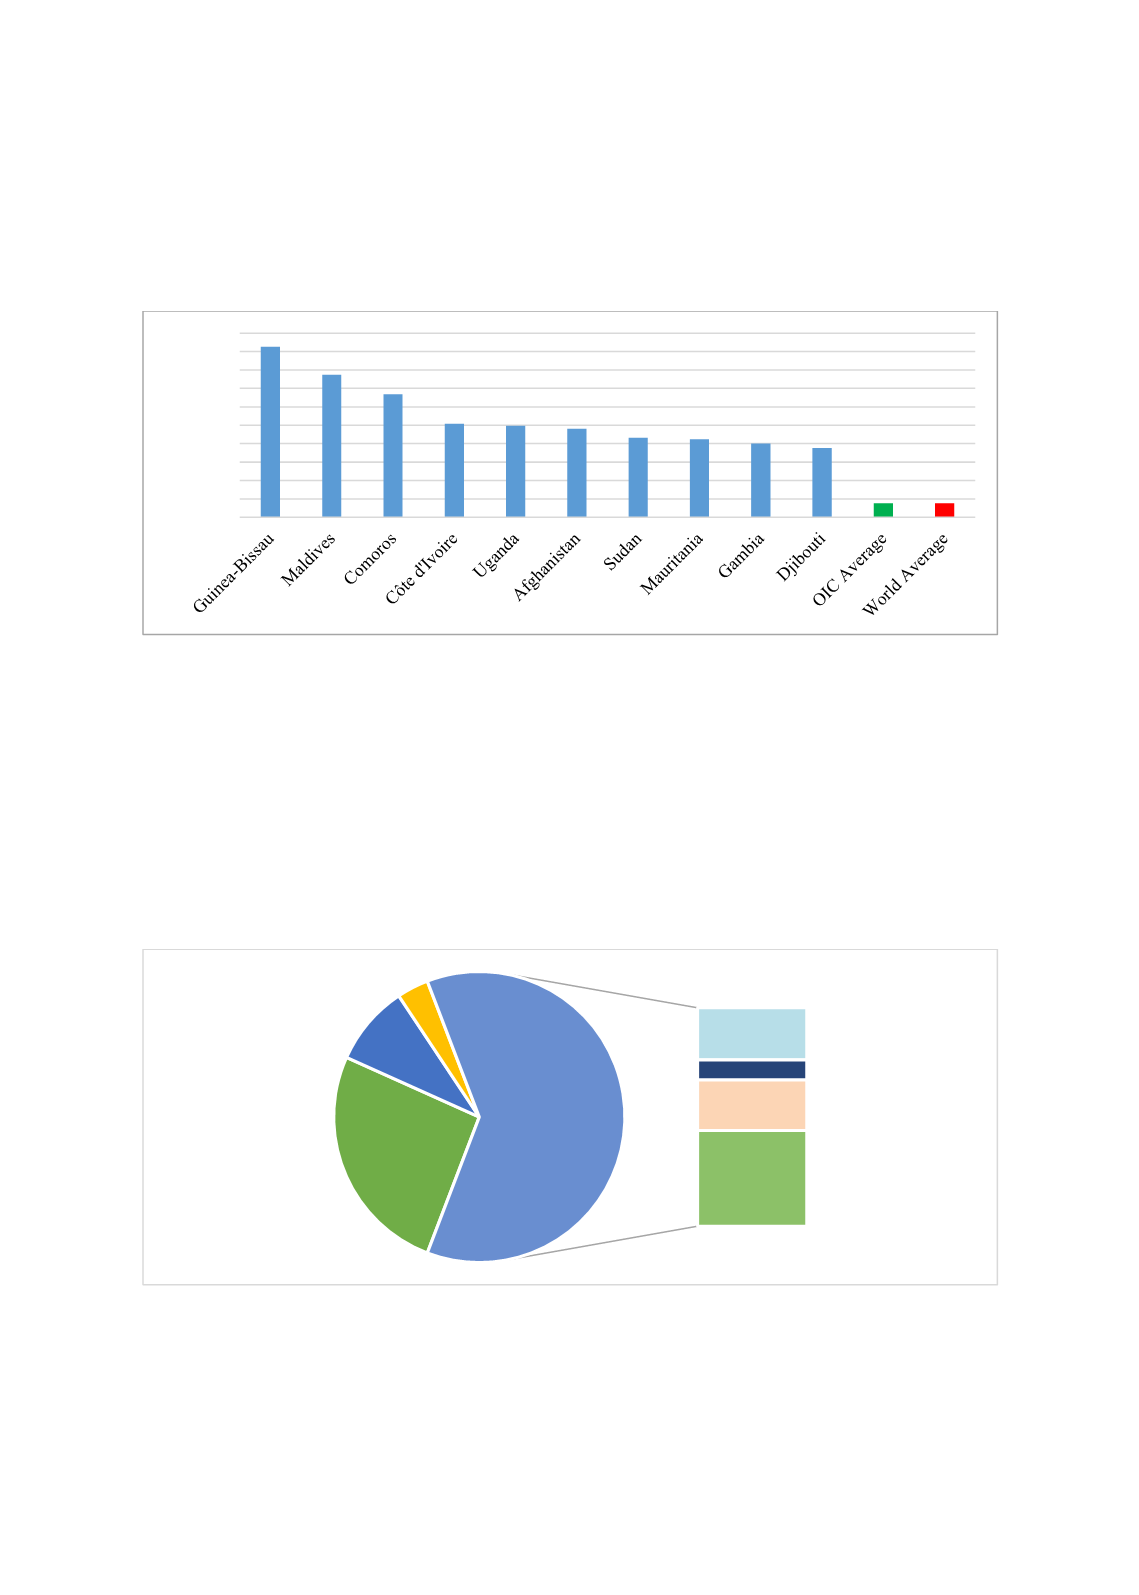
As shown in Figure 20 the share of basic food items such as food and live animals, oil seeds and
animal and vegetable oils constituted as much as 43 to 93 per cent of exports in Guinea Bissau,
Maldives, Comoros, Cote d’Ivoire, Uganda, Afghanistan and Sudan.
Figure 20: Share of Basic Food (SITC 0+22+4) in Total Exports, 2017
Source: UNCTADSTAT
Although the share of manufacturing in total OIC exports is 37.7 per cent in 2017, manufactured
products constitute a considerable part of exports in some OIC countries such as Bangladesh,
Pakistan, Turkey, Morocco and Malaysia where the share of manufactured goods exports in total
exports ranged between 67 to 95 per cent (see Table 4).
Figure 21 illustrates the sectoral breakdown of OIC exports along with the breakdown of
manufacturing exports by degree of manufacturing in 2017. Of the total OIC manufacturing
exports 44 per cent is high-skill and technology-intensive manufactures, 24 per cent is labor-
intensive and resource-intensive manufactures, 23 per cent is medium-skill and technology-
intensive manufactures and 9 per cent is low-skill and technology-intensive manufactures.
Figure 21: OIC Exports by Degree of Manufacturing, 2017
Source: UNCTADSTAT
Table 4 provides the details of the largest manufactured goods exporters of OIC by degree of
manufacturing in 2017. Malaysia, United Arab Emirates, Turkey and Indonesia as being the
largest manufactured goods exporters realized as a whole 66.3 per cent of total OIC
manufactured goods exports. Labor-intensive and resource-intensive manufactures make up 97
92.7
77.3
66.8
50.8
49.7
48.0
43.2 42.4 40.0 37.7
7.7 7.6
0
10
20
30
40
50
60
70
80
90
100
Per cent
Fuels; 42
Primary
commodities…
Other; 06
Labor Intensive; 24
Low Skill; 09
Medium Skill; 23
High Skill; 44
Manufactures; 37.7%


