


 17 / 133

COMCEC Trade Outlook 2018
9
2.
MERCHANDISE TRADE BETWEEN OIC AND THE WORLD
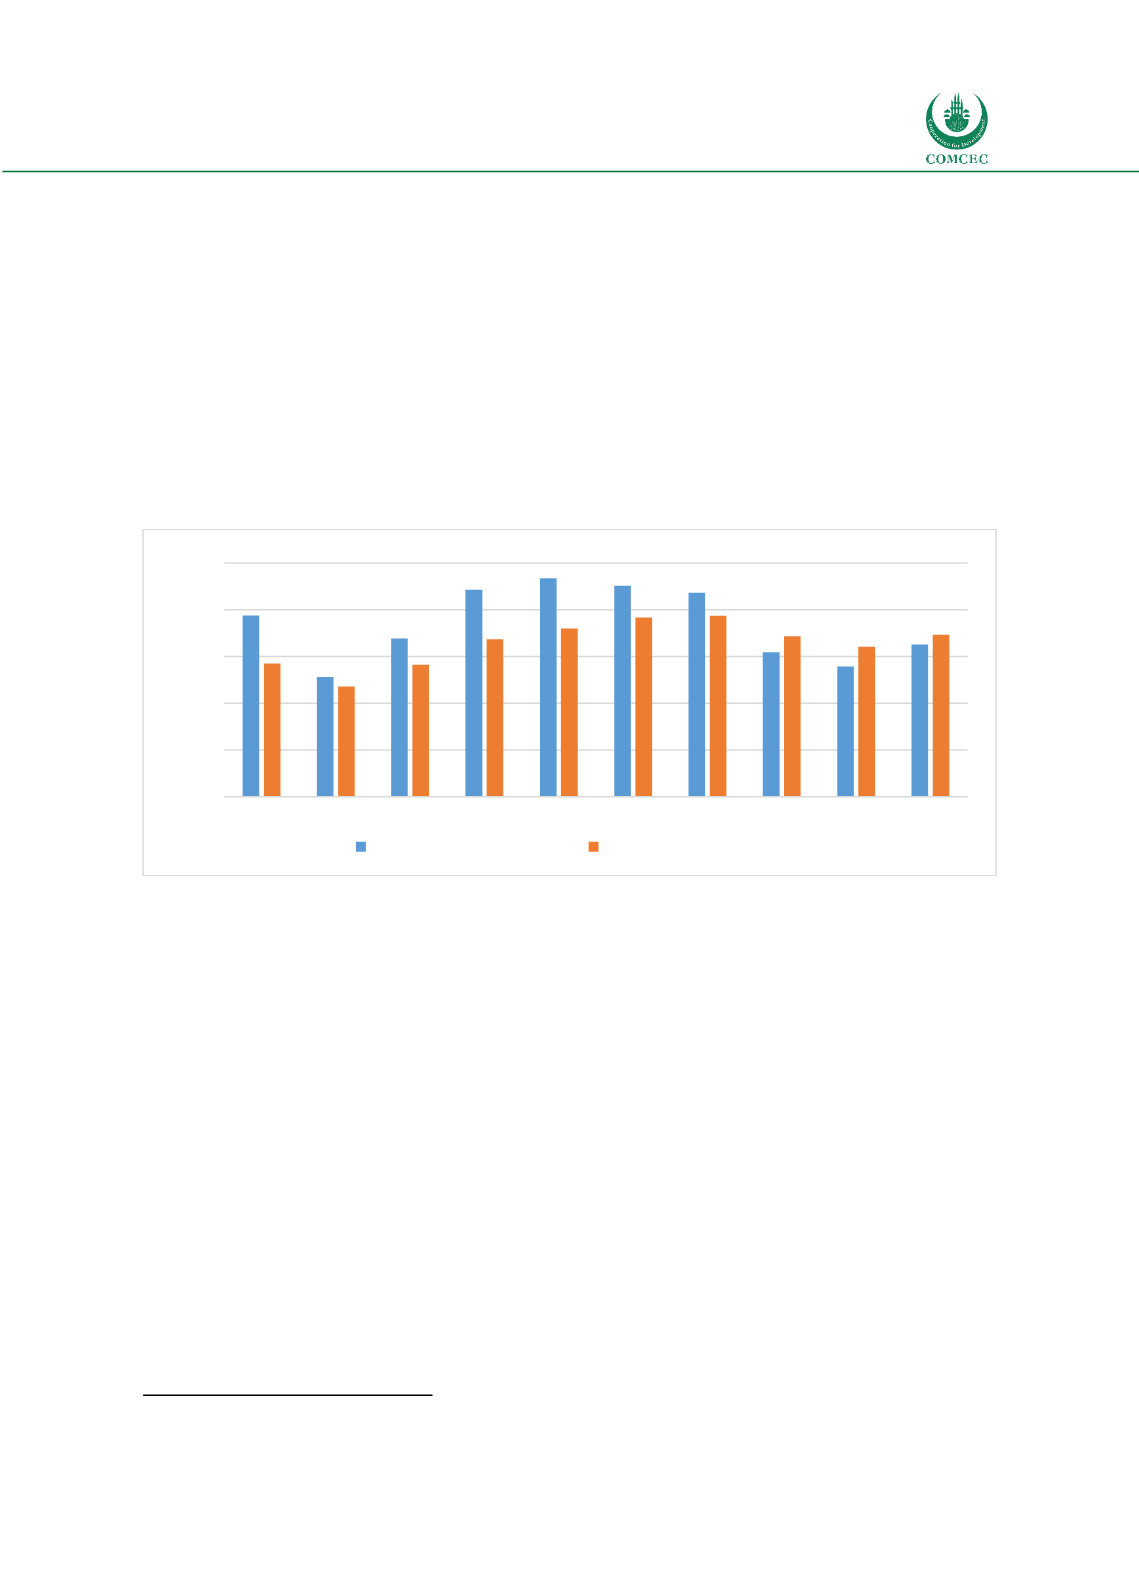
Total OIC exports which have been on a downward
trend since 2012 contracted severely in 2015 and
2016. However in 2017 total OIC exports recorded an
increase for the first time since 2012. Thus, the total
OIC exports increased strongly by 17.1 per cent to 1.6
trillion dollars in 2017 up from 1.4 trillion dollars in
2016. Meanwhile total OIC imports which fell by 11.3 per cent and 6.6 per cent in 2015 and 2016
respectively, picked up by 8 per cent and amounted to 1.7 trillion dollars. Thus total OIC trade
increased by 12.3 per cent to 3.4 trillion dollars in 2017 up from 3.0 trillion dollars in 2016.
Figure 8: Total OIC Exports and Imports
Source: IMF Direction of Trade Statistics
Several factors accounted for the strong performance in total OIC exports in 2017 including the
revival of global economic activity and rising commodity prices. On the other hand, ongoing
political developments in many countries in the Middle East constrain further increases in the
OIC trade. Rising commodity prices, in particular oil prices led to increased export revenues of
resource based countries which in turn resulted in more import demand.
Growth performance and rebalancing of Chinese economy away from manufacturing and
investment to services and consumption being the main export market for OIC countries is
particularly important as further slowdown in Chinese growth might have negative implications
on OIC exports. Chinese economy maintained a remarkable growth by growing 10.3 per cent
annually between 2000 and 2010 which led the surge in commodity prices in 2000s. However
the pace of growth has slowed down since 2011 and recorded as 6.9 per cent in 2017. It is
estimated to be slowing further in the coming years
9
. This could have negative spillovers on OIC
exports via downward pressure on commodity prices and lower import demand.
Commodity prices, in particular fuels, declined sharply starting from July 2014. Oil prices almost
halved from 96.2 dollars per barrel in 2014 to 50.8 dollars per barrel in 2015 mainly due to the
shale oil production in US and oversupply in global oil markets. Although oil prices bottomed
out 30.8 dollars per barrel in January 2016, they averaged 42.8 dollars per barrel in 2016. Oil
9
IMF WEO April 2018 Database.
0.0
0.5
1.0
1.5
2.0
2.5
2008 2009 2010 2011 2012 2013 2014 2015 2016 2017
Trillion USD
OIC Merchandise Exports
OIC Merchandise Imports
“In 2017 total OIC exports
increased for the first time
since 2012