


 15 / 133

COMCEC Trade Outlook 2018
7
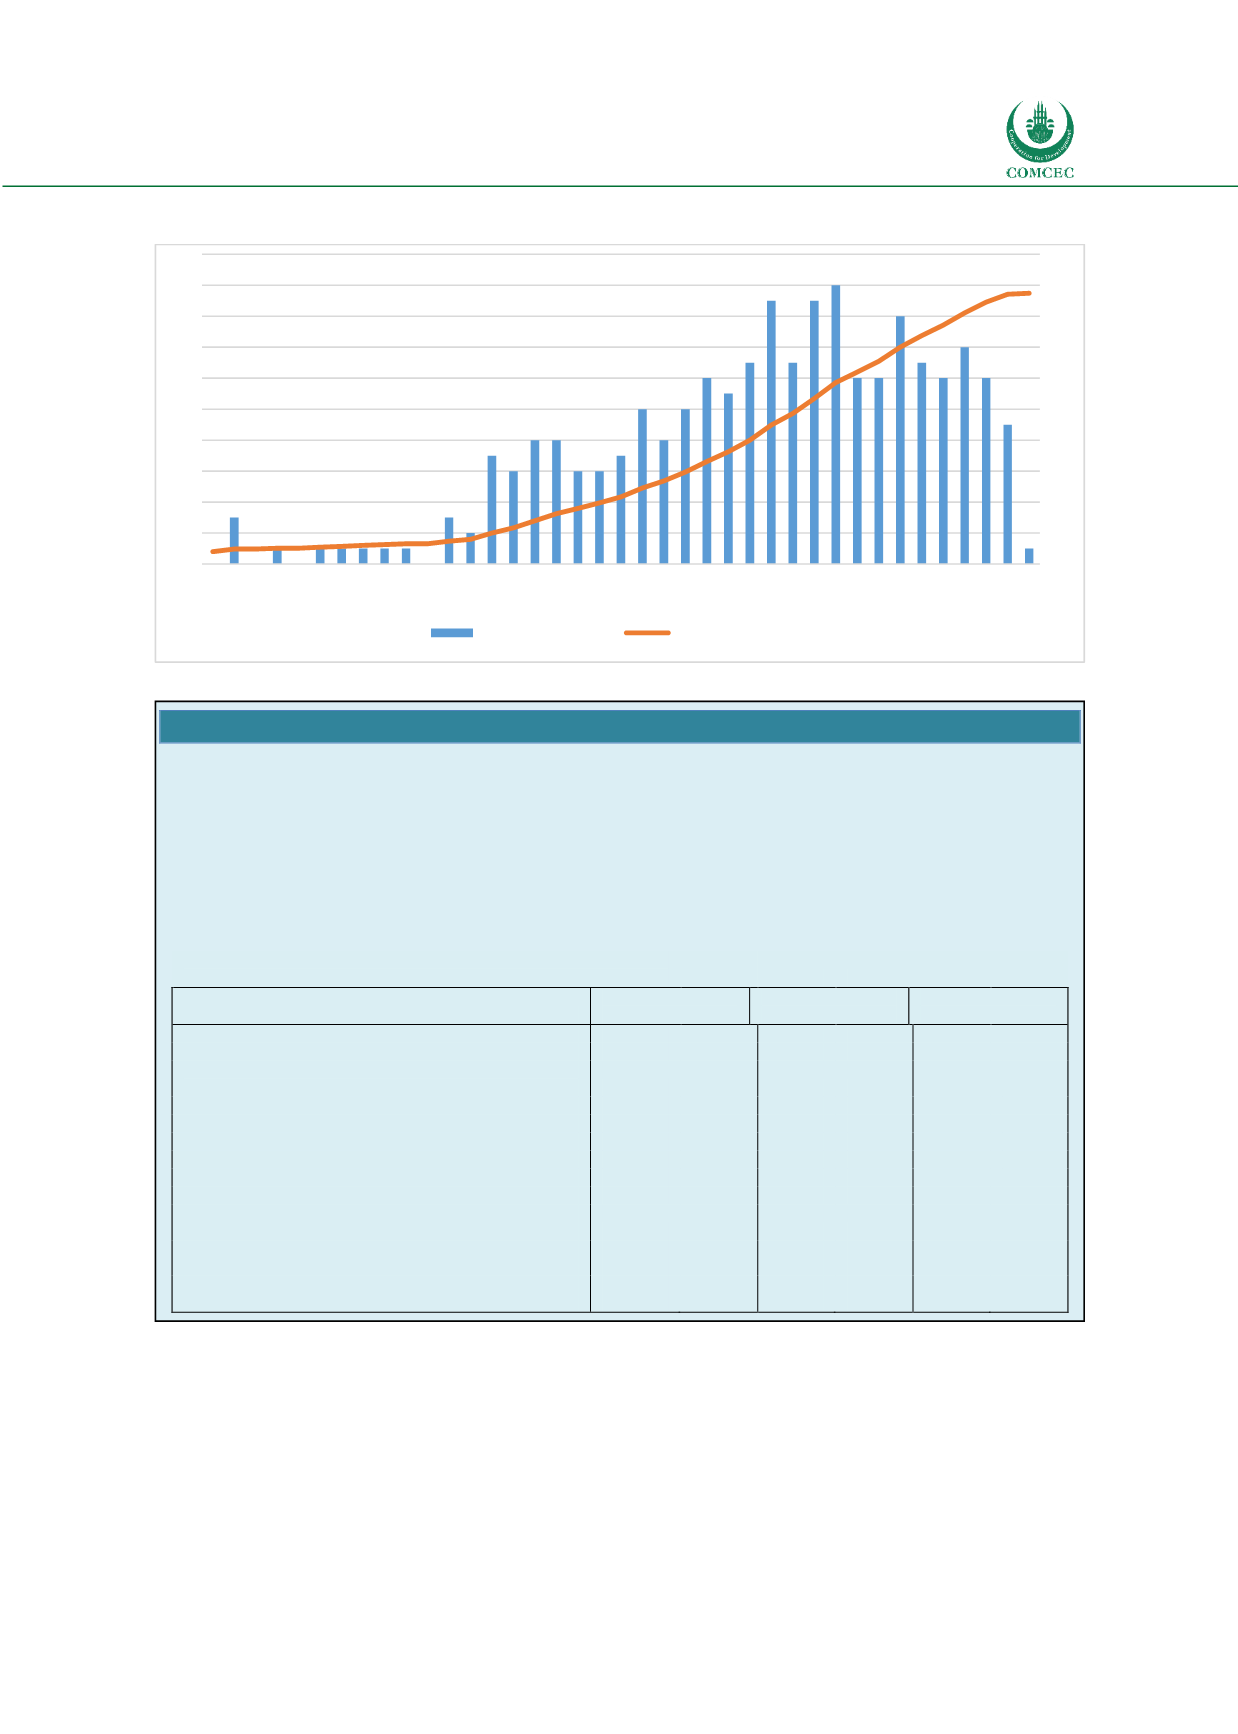
Figure 5: Evolution of RTAs (in force) in World
Source: WTO database
Source: UNCTADSTAT
The rising share of developing economies in world trade is the third dominant pattern in the
world trade. The share of developing countries in global exports which was 32.7 percent in 2001
peaked at 49.1 percent in 2012 and remained around 48 per cent in 2017. The rising share of
developing countries in world trade was driven by the rapid growth in South-South trade (trade
between the developing countries) and especially by the exports of Brazil, Russia, India and
China. The high growth of Developing countries trade is considered as a major driver of the
0
50
100
150
200
250
300
350
0
2
4
6
8
10
12
14
16
18
20
1980
1981
1982
1983
1984
1985
1986
1987
1988
1989
1990
1991
1992
1993
1994
1995
1996
1997
1998
1999
2000
2001
2002
2003
2004
2005
2006
2007
2008
2009
2010
2011
2012
2013
2014
2015
2016
2017
2018
Number per year
Cumulative number
Box 1: Regional Trade Agreements
Table-A below could be used to evaluate whether the steady increase in the number of regional agreements
in recent years affected the trade between member countries. As may be observed from the table, the EU
has the largest intra-trade shares, with intra-export and intra-import shares were 64 per cent and 60 per
cent respectively. For NAFTA, intra-export was 50 per cent while intra-imports was 33 percent. However in
ASEAN, most of the trade (77 per cent) was with the countries out of the agreement. On the other hand,
when some RTAs where some OIC member countries participated evaluated; intra-export shares in total
trade remained small for GCC, ECOWAS and WAEMU ranging between 10 to 14 per cent.
Table A: Intra and Extra Trade in Selected Preferential Trade
Agreements - 2016
World
(Billion Dollars)
Intra-PTA Share in
Total (%)
Extra-PTA Share in
Total (%)
Export
Import
Export
Import
Export
Import
ASEAN (Association of Southeast Asian Nations)
1,138.8
1,075.9
24.2
22.7
75.8
77.3
CEMAC (Economic and Monetary Community of Central
Africa)
20.2
19.5
3.1
4.2
96.9
95.8
CIS (Commonwealth of Independent States)
422.9
317.9
16.9
21.8
83.1
78.2
COMESA (Common Market for Eastern and Southern Africa)
67.2
143.8
10.2
5.3
89.8
94.7
EAC (East African Community)
13.5
31.6
20.3
6.8
79.7
93.2
ECOWAS (Economic Community of West African States)
73.3
87.1
10.6
9.4
89.4
90.6
EFTA (European Free Trade Association)
398.8
347.7
0.5
0.6
99.5
99.4
EU28 (European Union)
5,346.4
5,212.7
63.6
59.7
36.4
40.3
GCC (The Cooperation Council for the Arab States of the
Gulf)
588.0
448.2
10.4
10.9
89.6
89.1
MERCOSUR (Southern Common Market)
282.1
223.6
13.1
15.8
86.9
84.2
NAFTA (North American Free Trade Agreement)
2,216.1
3,039.7
50.2
33.2
49.8
66.8
SAARC (South Asian Association for Regional Cooperation)
327.7
486.3
7.0
5.2
93.0
94.8
WAEMU (West African Economic and Monetary Union)
23.5
28.7
14.4
8.2
85.6
91.8