


 12 / 133

4
The difference between trade growth in dollar terms and volume terms mainly stems from the
changes in exchange rates and commodity prices.
1
Weighted average of the foreign exchange
value of the U.S. dollar against the currencies of major U.S. trading partners remained around
the same level of the previous year in 2017.
2
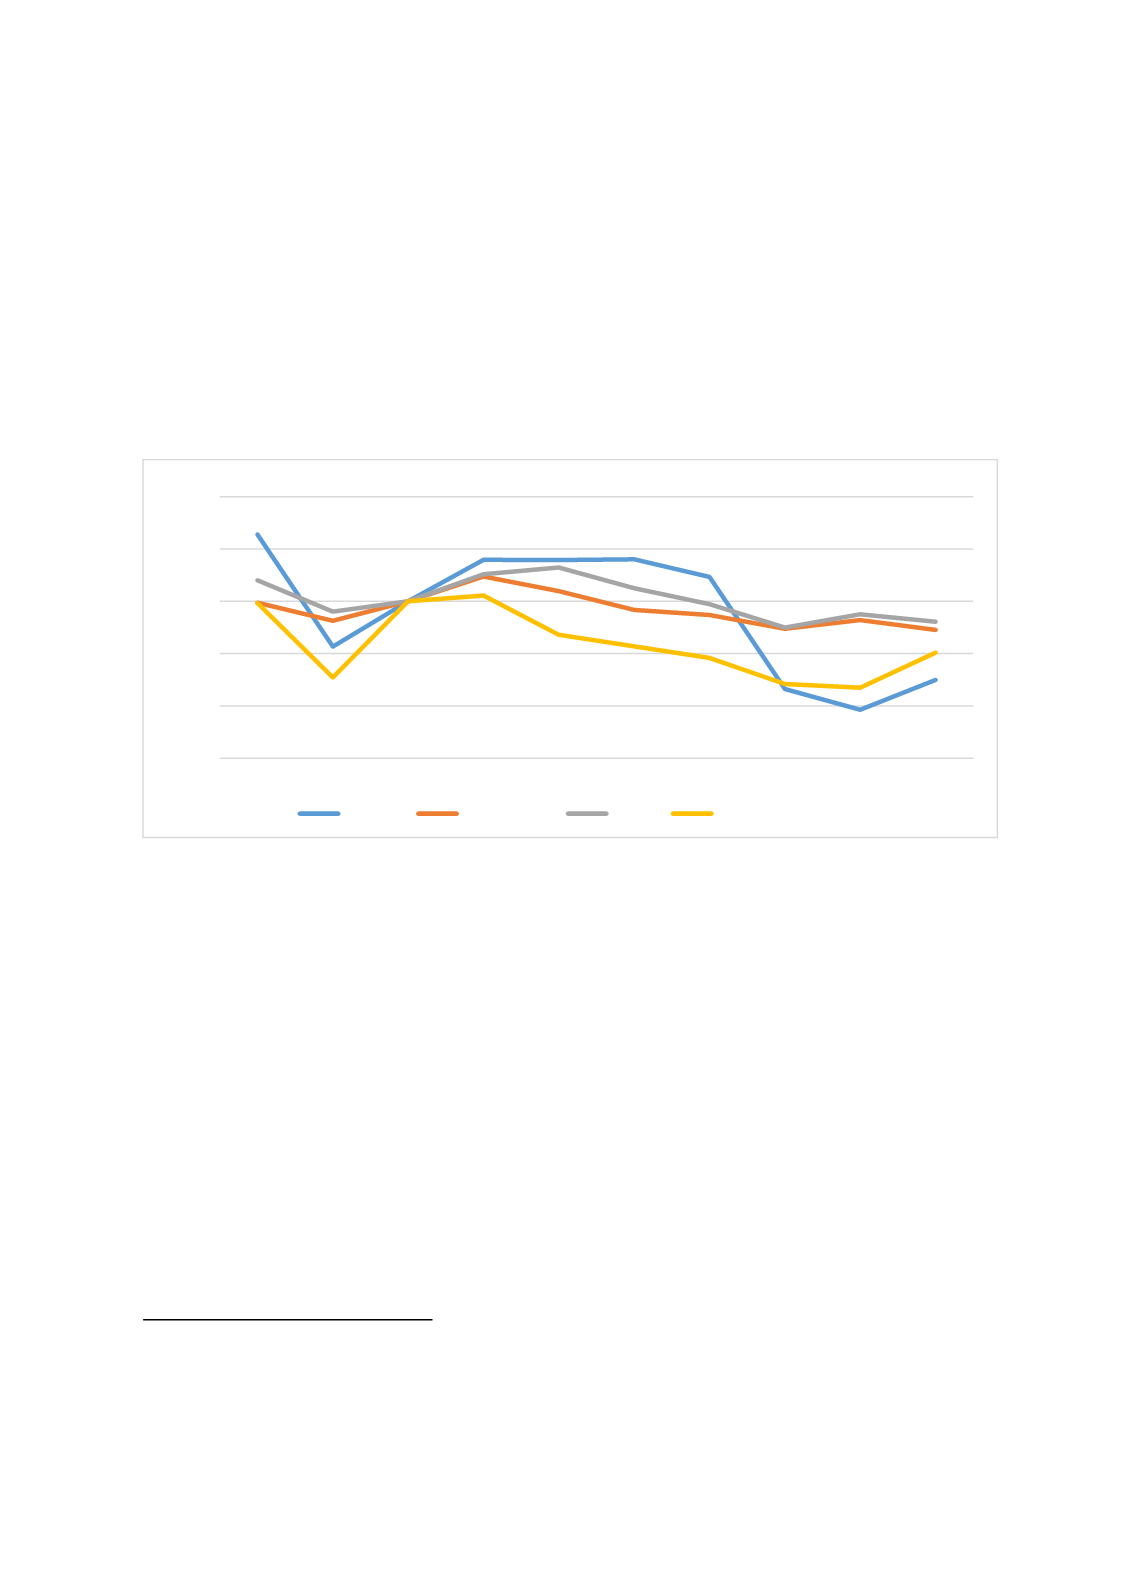
However primary commodity prices which have
been on a declining trend since 2012 increased strongly in 2017. Fuels increased by 23.6
percent, non-energy prices increased by 5.4 per cent, metals prices increased by 24.2 per cent
in 2017 while agriculture prices declined by 0.7 per cent year on year in 2017. Therefore, strong
increase in world trade value was mainly driven both by rising commodity prices and quantity
traded.
3
Figure 3: Evolution of the Commodity Prices
Source: World Bank Commodity Price Data
The strong performance world trade volume in 2017was mainly due to cyclical factors including
robust global economic activity with high investment spending and consumption components.
World output increased by 2.3 per cent in 2017 up from 1.6 per cent in 2016. Moreover,
increases in commodity prices led to higher incomes in commodity exporters (which increases
import demand) and investment in the energy sector.
4
A recent World Bank study
5
notes however that some structural factors such, the maturation of
global value chains and slower pace of trade liberalization continue to constrain world trade
growth.
The high growth rate of world trade volume in 2017 was driven mainly by increases in import
demand from both developed and developing economies. Developed economies imports grew
by 3.1 per cent in 2017 up from 2.0 per cent in 2016. However growth rate of developing
economies imports was more remarkable as they jumped from 1.9 per cent in 2016 to 7.2 per
cent in 2017. Meanwhile exports grew 3.5 per cent in developed countries and 5.7 per cent in
developing countries in 2017.
1
WTO Press Release April 2018
2
https://fred.stlouisfed.org/series/TWEXB3
WTO World Trade Statistical Review 2018
4
WTO Press Release April 2018
5
World Bank Global Economic Prospects 2018
40
60
80
100
120
140
2008 2009 2010 2011 2012 2013 2014 2015 2016 2017
Price Indices (2010=100)
Energy
Agriculture
Food
Metals & Minerals