
Financial Outlook of the OIC Member Countries 2016
23
reserves, retained earnings and as such considerable as capital. In 2014, the level of this
measure decreased compared to the level at the previous year whereas the level increased
during this period in the world (Figure 20).
Measure of bank nonperforming loans to gross loans (%) shows how successful a bank to pick
projects or extend credits. However, in countries where macroeconomic stability is a big issue,
this measure quickly reaches higher levels without bankruptcy calls of banks. Hence, this
measure is inversely related to macroeconomic stability and the unused capacity of banks to
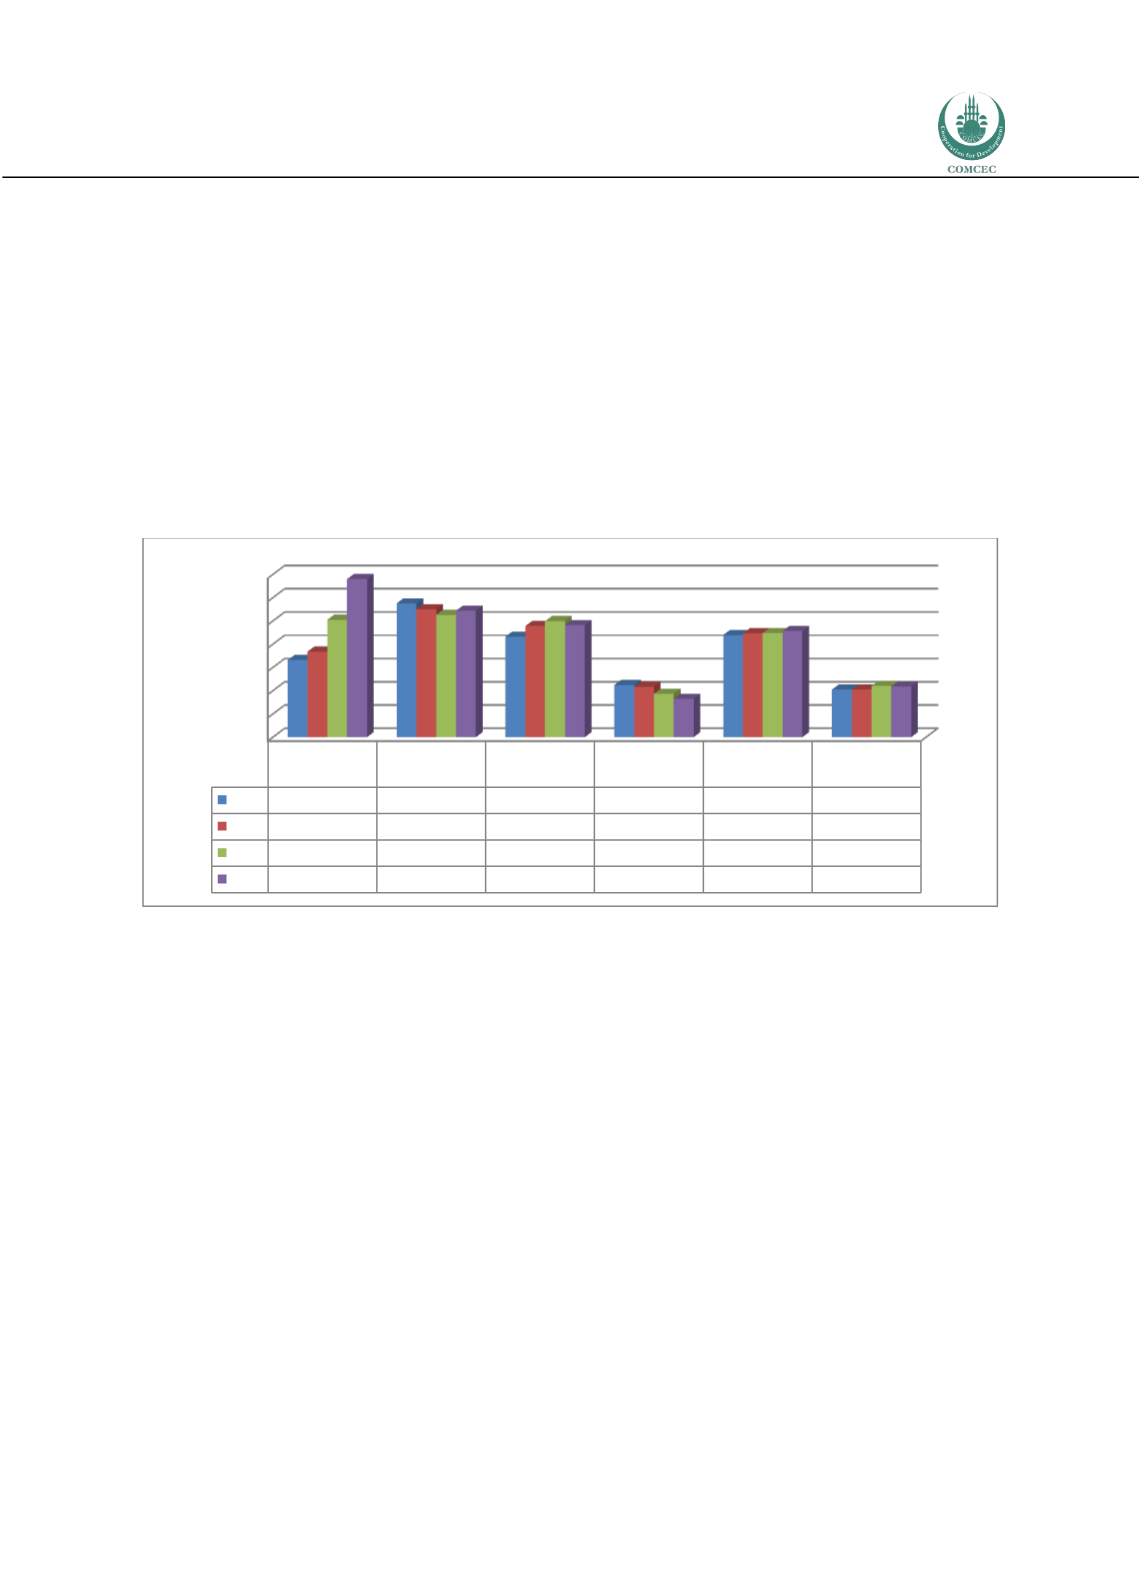
buffer further shocks. Banks nonperforming loans to gross loans peaked to 13.6 per cent in
2014 from 6.6 per cent in 2011 for OIC-LIG. World average of this measure is about 4 per cent.
The figures are 10.9, 9.6 and 3.3 per cent for OIC-LMIG, OIC-UMIG and OIC-HIGH respectively
in 2014.
Figure 21: Bank nonperforming loans to gross loans (%)
Source: COMCEC Coordination Office staff estimations by using Global Financial Development Database, World
Bank (2016b)
0
2
4
6
8
10
12
14
OIC-LIG
Average
OIC-LMIG
Average
OIC-UMIG
Average
OIC-HIGH
Average
OIC Average
World
2011
6,63
11,51
8,65
4,50
8,79
4,10
2012
7,37
11,02
9,56
4,33
8,93
4,10
2013
10,10
10,53
9,98
3,74
8,96
4,40
2014
13,60
10,88
9,64
3,30
9,13
4,35


