


 45 / 164

Malnutrition in the OIC Member
Countries: A Trap for Poverty
COMCEC
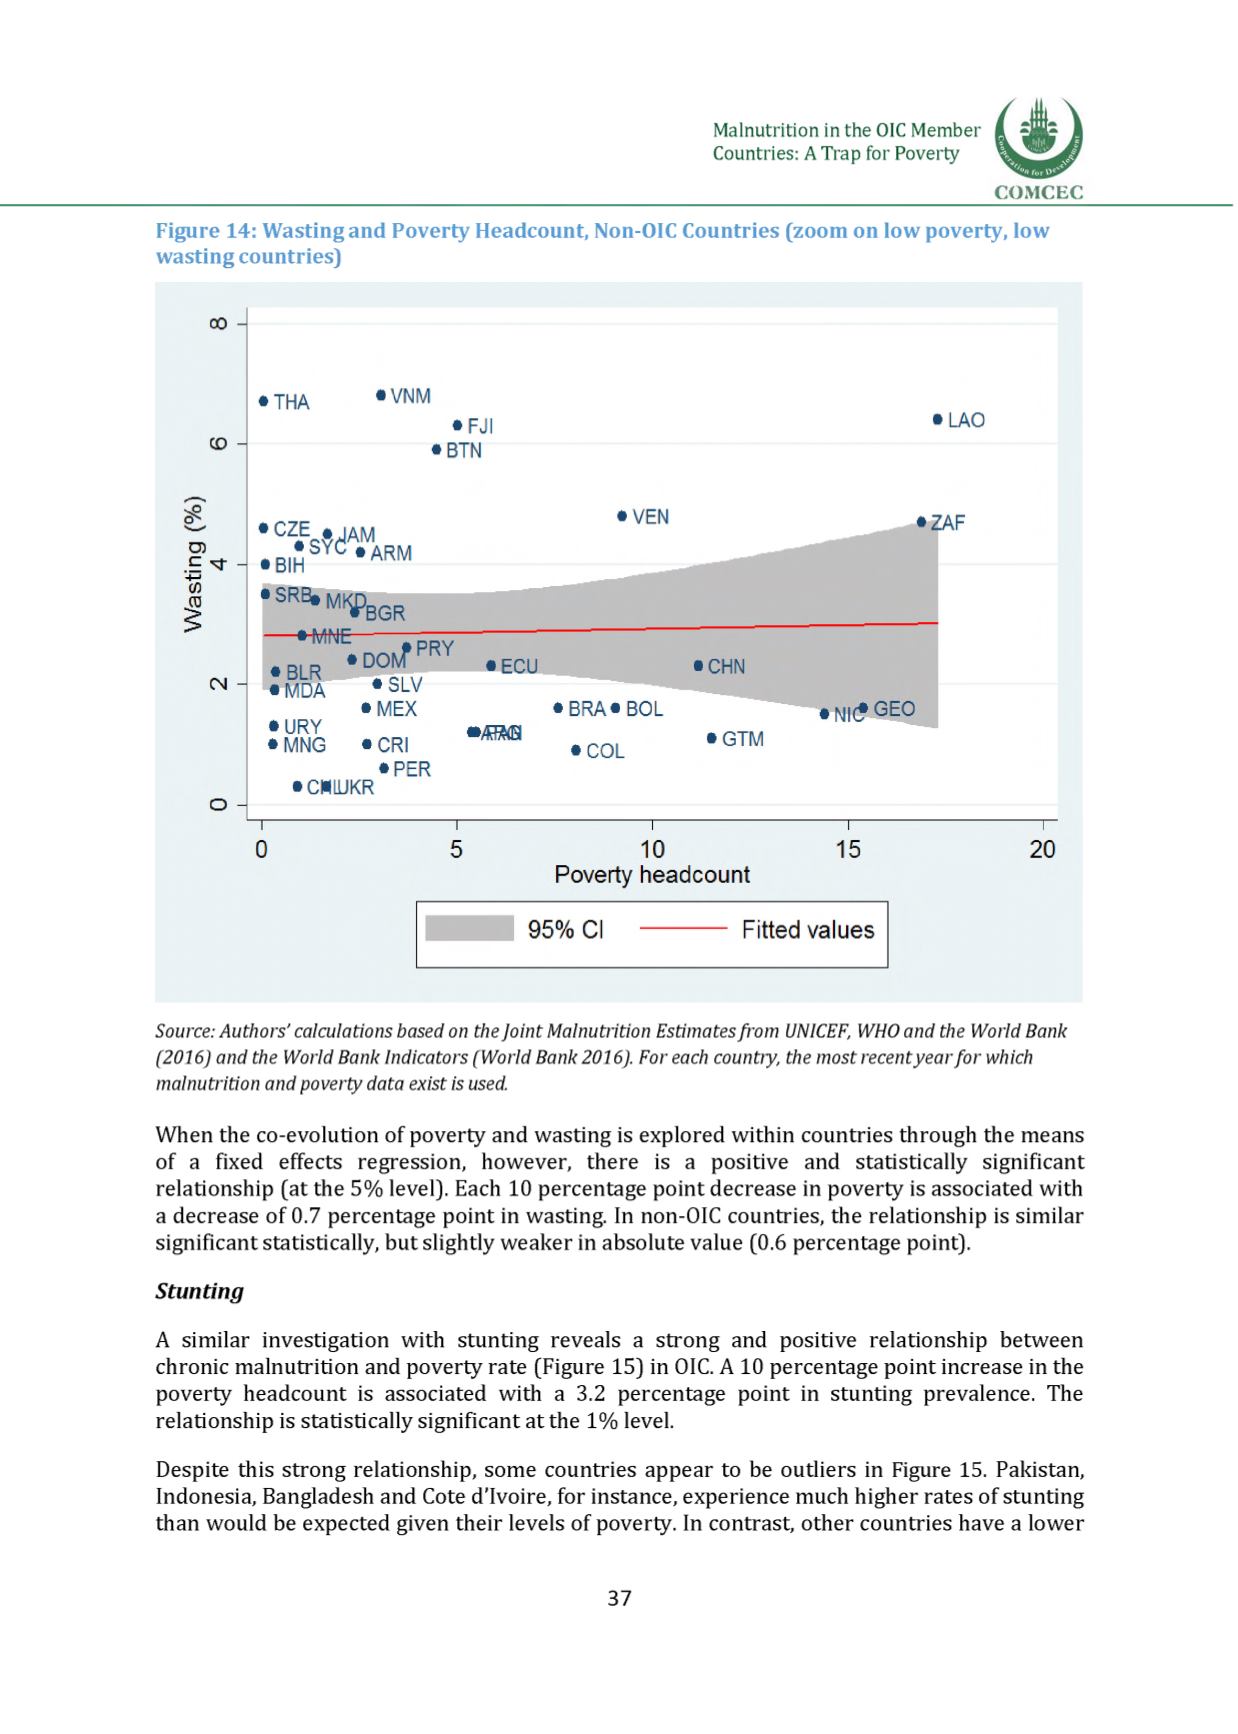
Figure 14: Wasting and Poverty Headcount, Non-OIC Countries (zoom on low poverty, low
wasting countries)
Source: Authors' calculations based on theJoint Malnutrition Estimatesfrom UNICEF, WHOand the World Bank
(2016) and the World Bank Indicators (World Bank 2016). For each country, the most recentyearfor which
malnutrition and poverty data exist is used.
When the co-evolution of poverty and wasting is explored within countries through the means
of a fixed effects regression, however, there is a positive and statistically significant
relationship (at the 5% level). Each 10 percentage point decrease in poverty is associated with
a decrease of 0.7 percentage point in wasting. In non-OIC countries, the relationship is similar
significant statistically, but slightly weaker in absolute value (0.6 percentage point).
Stunting
A similar investigation with stunting reveals a strong and positive relationship between
chronic malnutrition and poverty rate
(Figure 15)in OIC. A 10 percentage point increase in the
poverty headcount is associated with a 3.2 percentage point in stunting prevalence. The
relationship is statistically significant at the 1% level.
Despite this strong relationship, some countries appear to be outliers i
n Figure 15. Pakistan,
Indonesia, Bangladesh and Cote d'Ivoire, for instance, experience much higher rates of stunting
than would be expected given their levels of poverty. In contrast, other countries have a lower
37