
Malnutrition in the OIC Member
Countries: A Trap for Poverty
2.3. Malnutrition and Poverty in the OIC Member Countries
To assess the relationship between malnutrition and poverty in OIC countries, the poverty
headcount calculated at the $1.9 per day threshold is used. The data come from the World Data
Indicators, World Bank. The relationship is assessed using the latest measurement of
malnutrition available for each country. Due to data limitations (some countries have patchy
poverty data, and it sometimes do not overlap with the period of measurement of
malnutrition), only between 34 and 40 OIC countries are included in the analysis.
Wasting
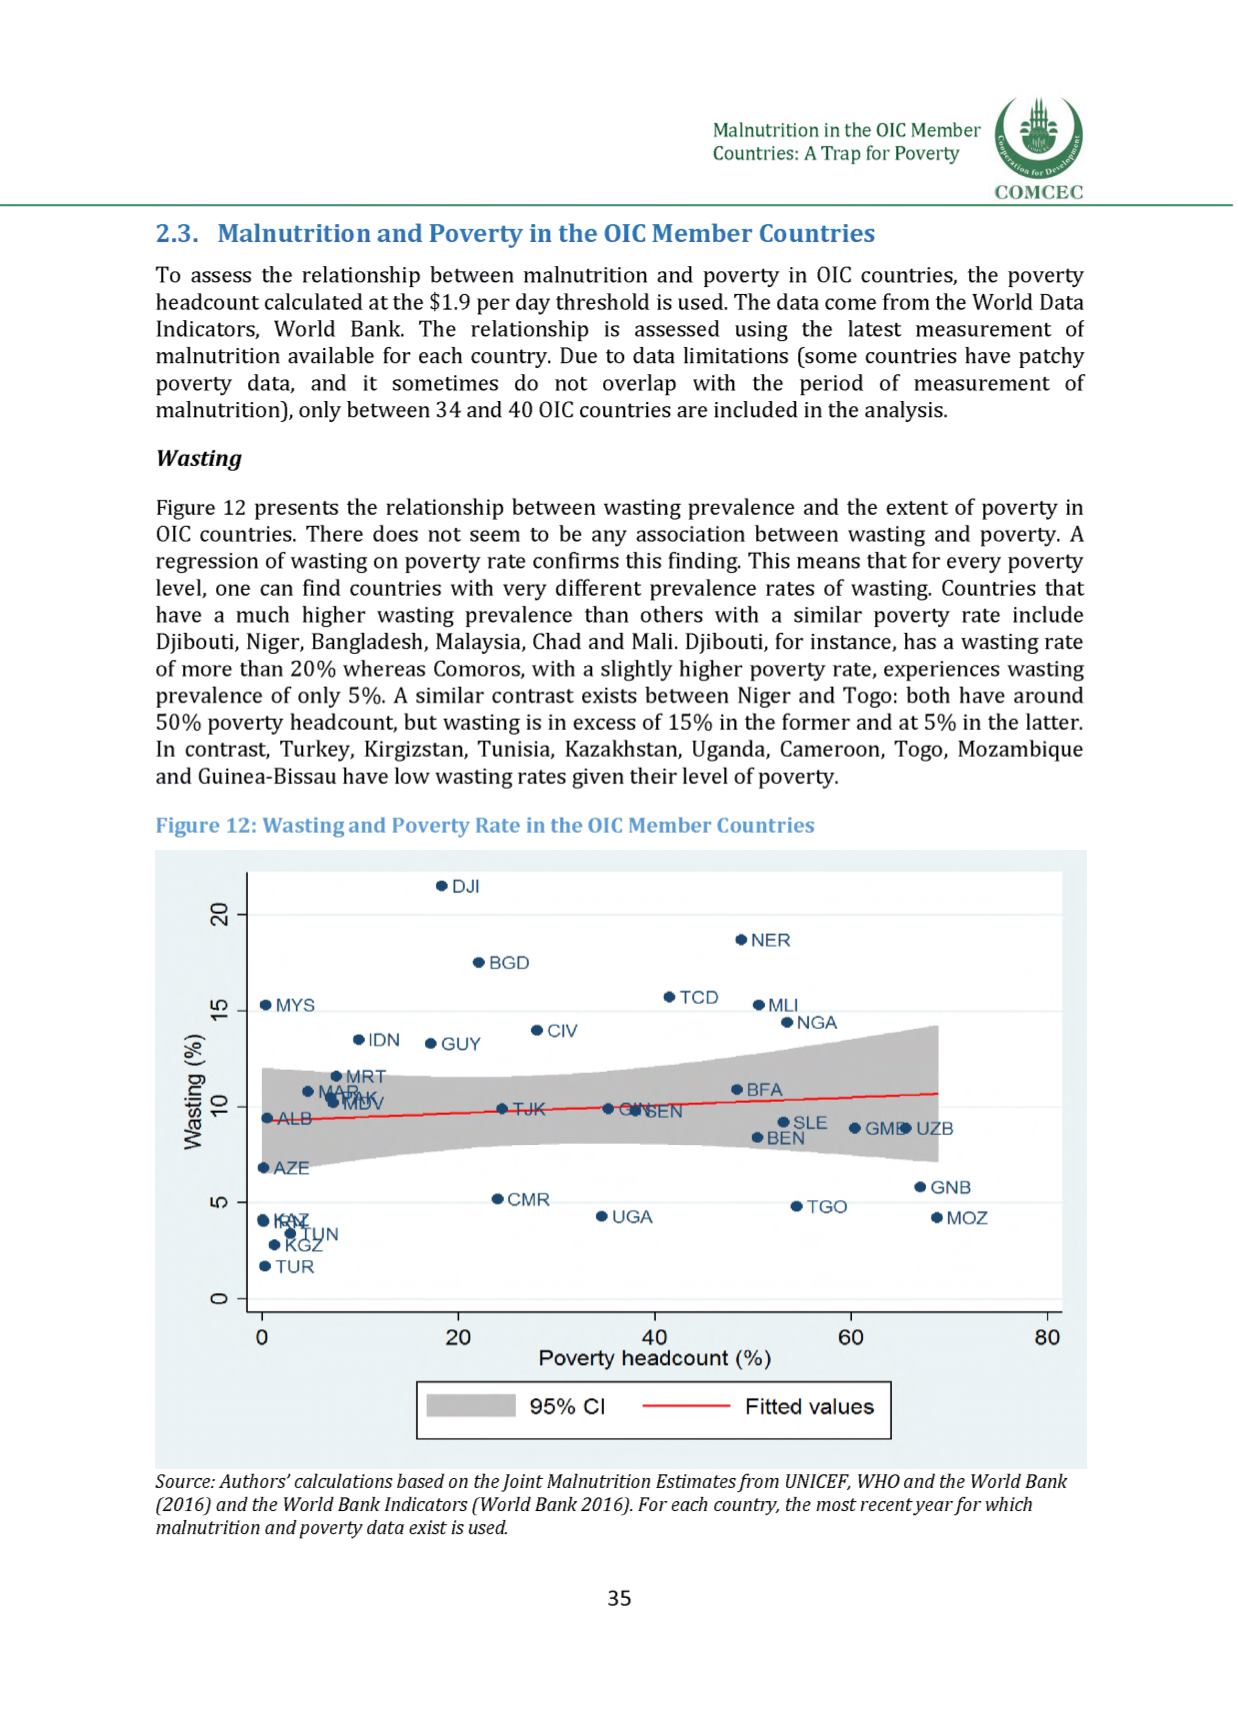
Figure 12 presents the relationship between wasting prevalence and the extent of poverty in
OIC countries. There does not seem to be any association between wasting and poverty. A
regression of wasting on poverty rate confirms this finding. This means that for every poverty
level, one can find countries with very different prevalence rates of wasting. Countries that
have a much higher wasting prevalence than others with a similar poverty rate include
Djibouti, Niger, Bangladesh, Malaysia, Chad and Mali. Djibouti, for instance, has a wasting rate
of more than 20% whereas Comoros, with a slightly higher poverty rate, experiences wasting
prevalence of only 5%. A similar contrast exists between Niger and Togo: both have around
50% poverty headcount, but wasting is in excess of 15% in the former and at 5% in the latter.
In contrast, Turkey, Kirgizstan, Tunisia, Kazakhstan, Uganda, Cameroon, Togo, Mozambique
and Guinea-Bissau have low wasting rates given their level of poverty.
Figure 12: Wasting and Poverty Rate in the OICMember Countries
Source: Authors' calculations based on theJoint Malnutrition Estimatesfrom UNICEF, WHOand the World Bank
(2016) and the World Bank Indicators (World Bank 2016). For each country, the most recentyearfor which
malnutrition and poverty data exist is used.
35


