
Malnutrition in the OIC Member
Countries: A Trap for Poverty
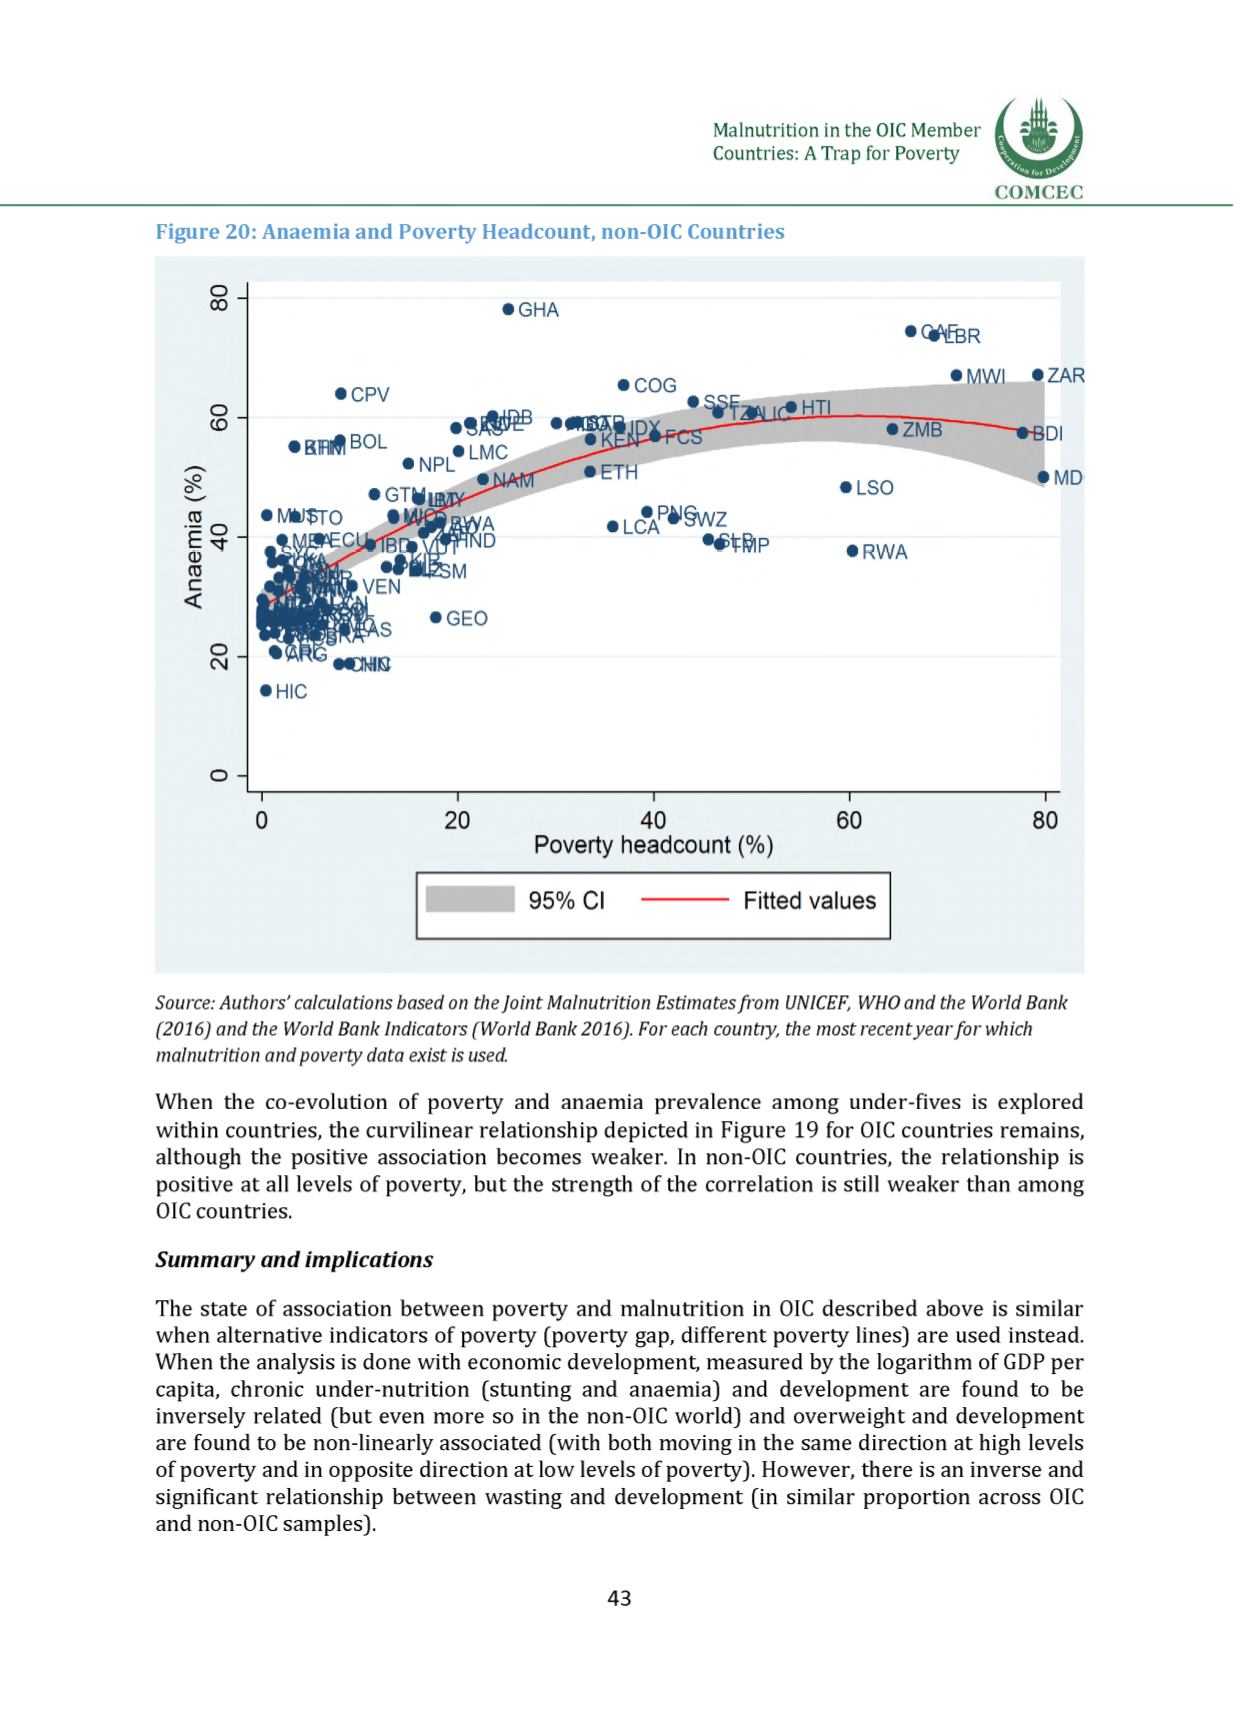
Figure 20: Anaemia and Poverty Headcount, non-OIC Countries
Source: Authors' calculations based on theJoint Malnutrition Estimatesfrom UNICEF, WHOand the World Bank
(2016) and the World Bank Indicators (World Bank 2016). For each country, the most recentyearfor which
malnutrition and poverty data exist is used.
When the co-evolution of poverty and anaemia prevalence among under-fives is explored
within countries, the curvilinear relationship depicted i
n Figure 19 for OIC countries remains,
although the positive association becomes weaker. In non-OIC countries, the relationship is
positive at all levels of poverty, but the strength of the correlation is still weaker than among
OIC countries.
Summary and implications
The state of association between poverty and malnutrition in OIC described above is similar
when alternative indicators of poverty (poverty gap, different poverty lines) are used instead.
When the analysis is done with economic development, measured by the logarithm of GDP per
capita, chronic under-nutrition (stunting and anaemia) and development are found to be
inversely related (but even more so in the non-OIC world) and overweight and development
are found to be non-linearly associated (with both moving in the same direction at high levels
of poverty and in opposite direction at low levels of poverty). However, there is an inverse and
significant relationship between wasting and development (in similar proportion across OIC
and non-OIC samples).
43


