
Malnutrition in the OIC Member
Countries: A Trap for Poverty
COMCEC
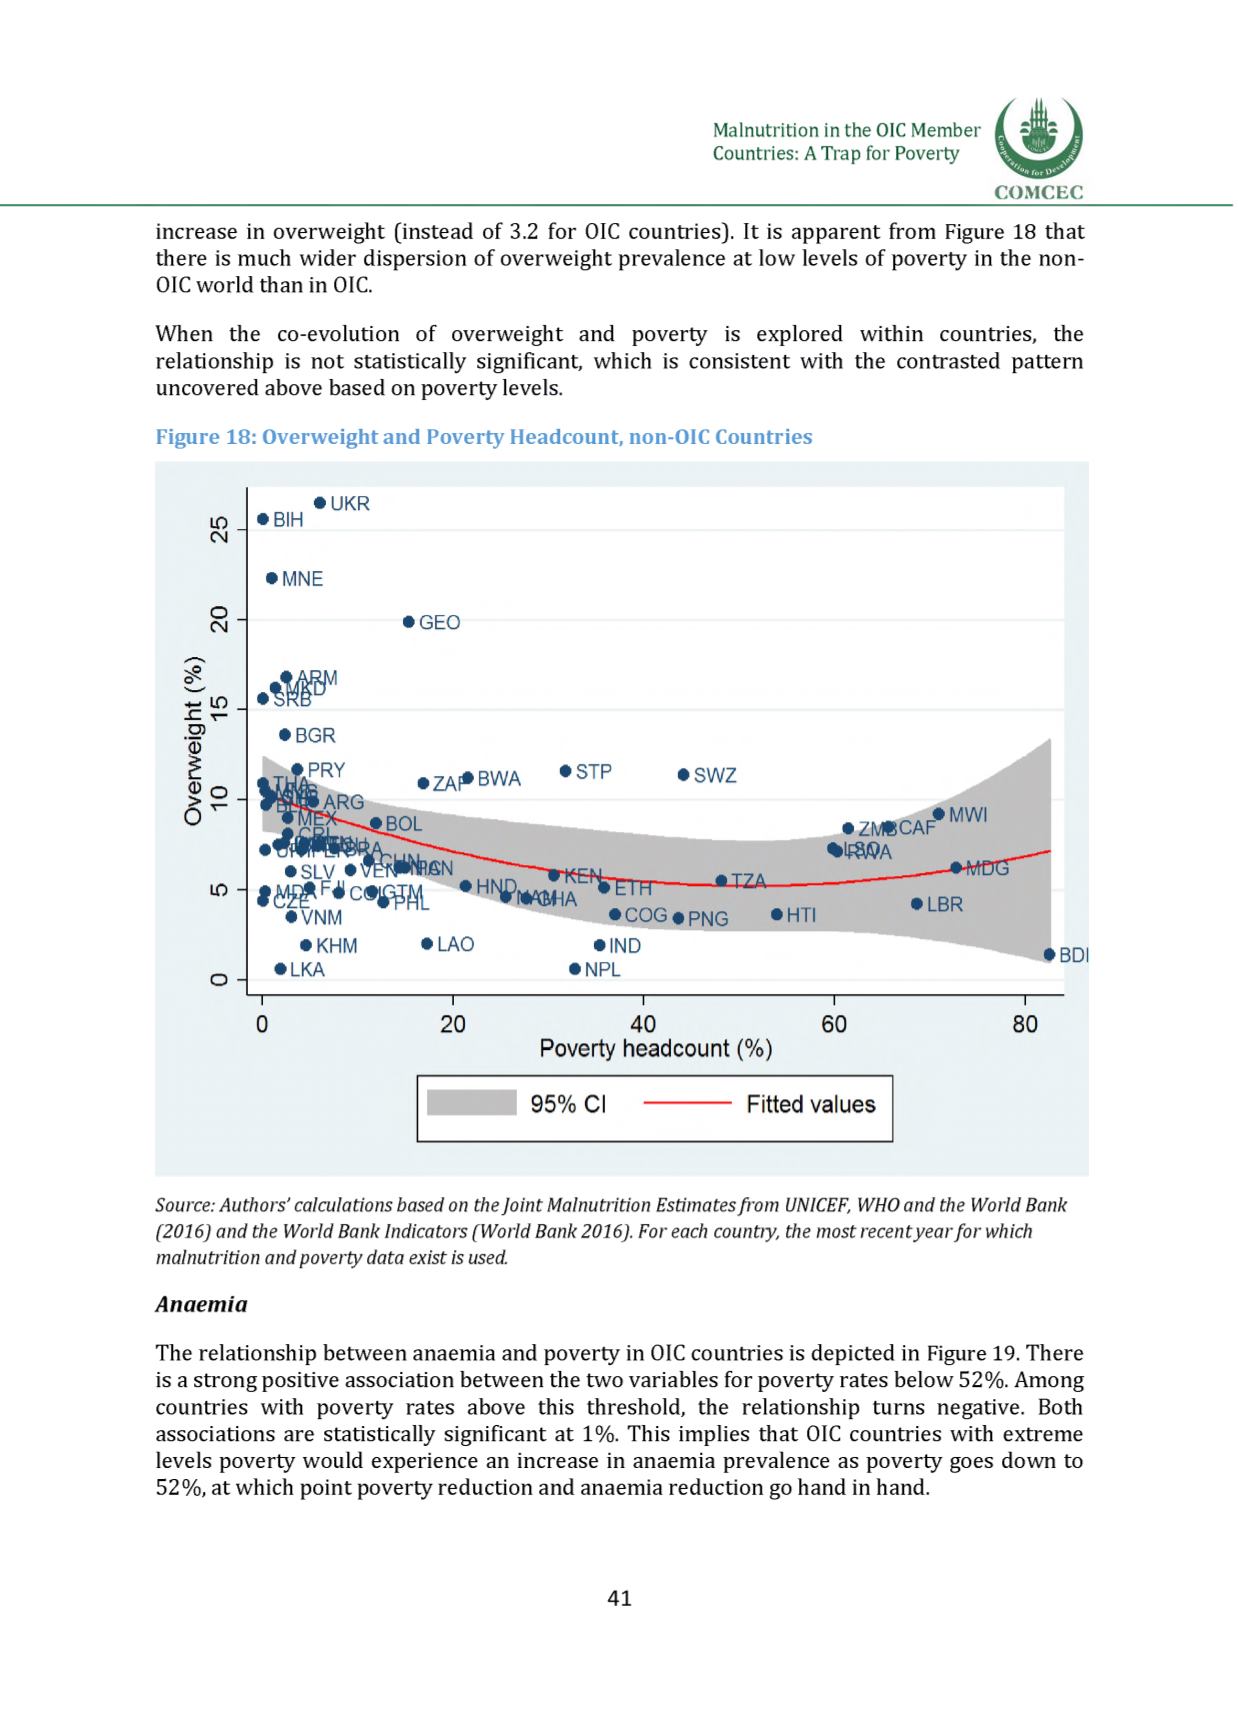
increase in overweight (instead of 3.2 for OIC countries). It is apparent fro
m Figure 18 that
there is much wider dispersion of overweight prevalence at low levels of poverty in the non-
OICworld than in OIC.
When the co-evolution of overweight and poverty is explored within countries, the
relationship is not statistically significant, which is consistent with the contrasted pattern
uncovered above based on poverty levels.
Figure 18: Overweight and Poverty Headcount, non-OIC Countries
Source: Authors' calculations based on theJoint Malnutrition Estimatesfrom UNICEF, WHOand the World Bank
(2016) and the World Bank Indicators (World Bank 2016). For each country, the most recentyearfor which
malnutrition and poverty data exist is used.
Anaemia
The relationship between anaemia and poverty in OIC countries is depicted i
n Figure 19.There
is a strong positive association between the two variables for poverty rates below 52%. Among
countries with poverty rates above this threshold, the relationship turns negative. Both
associations are statistically significant at 1%. This implies that OIC countries with extreme
levels poverty would experience an increase in anaemia prevalence as poverty goes down to
52%, at which point poverty reduction and anaemia reduction go hand in hand.
41


