
Malnutrition in the OIC Member
Countries: A Trap for Poverty
COMCEC
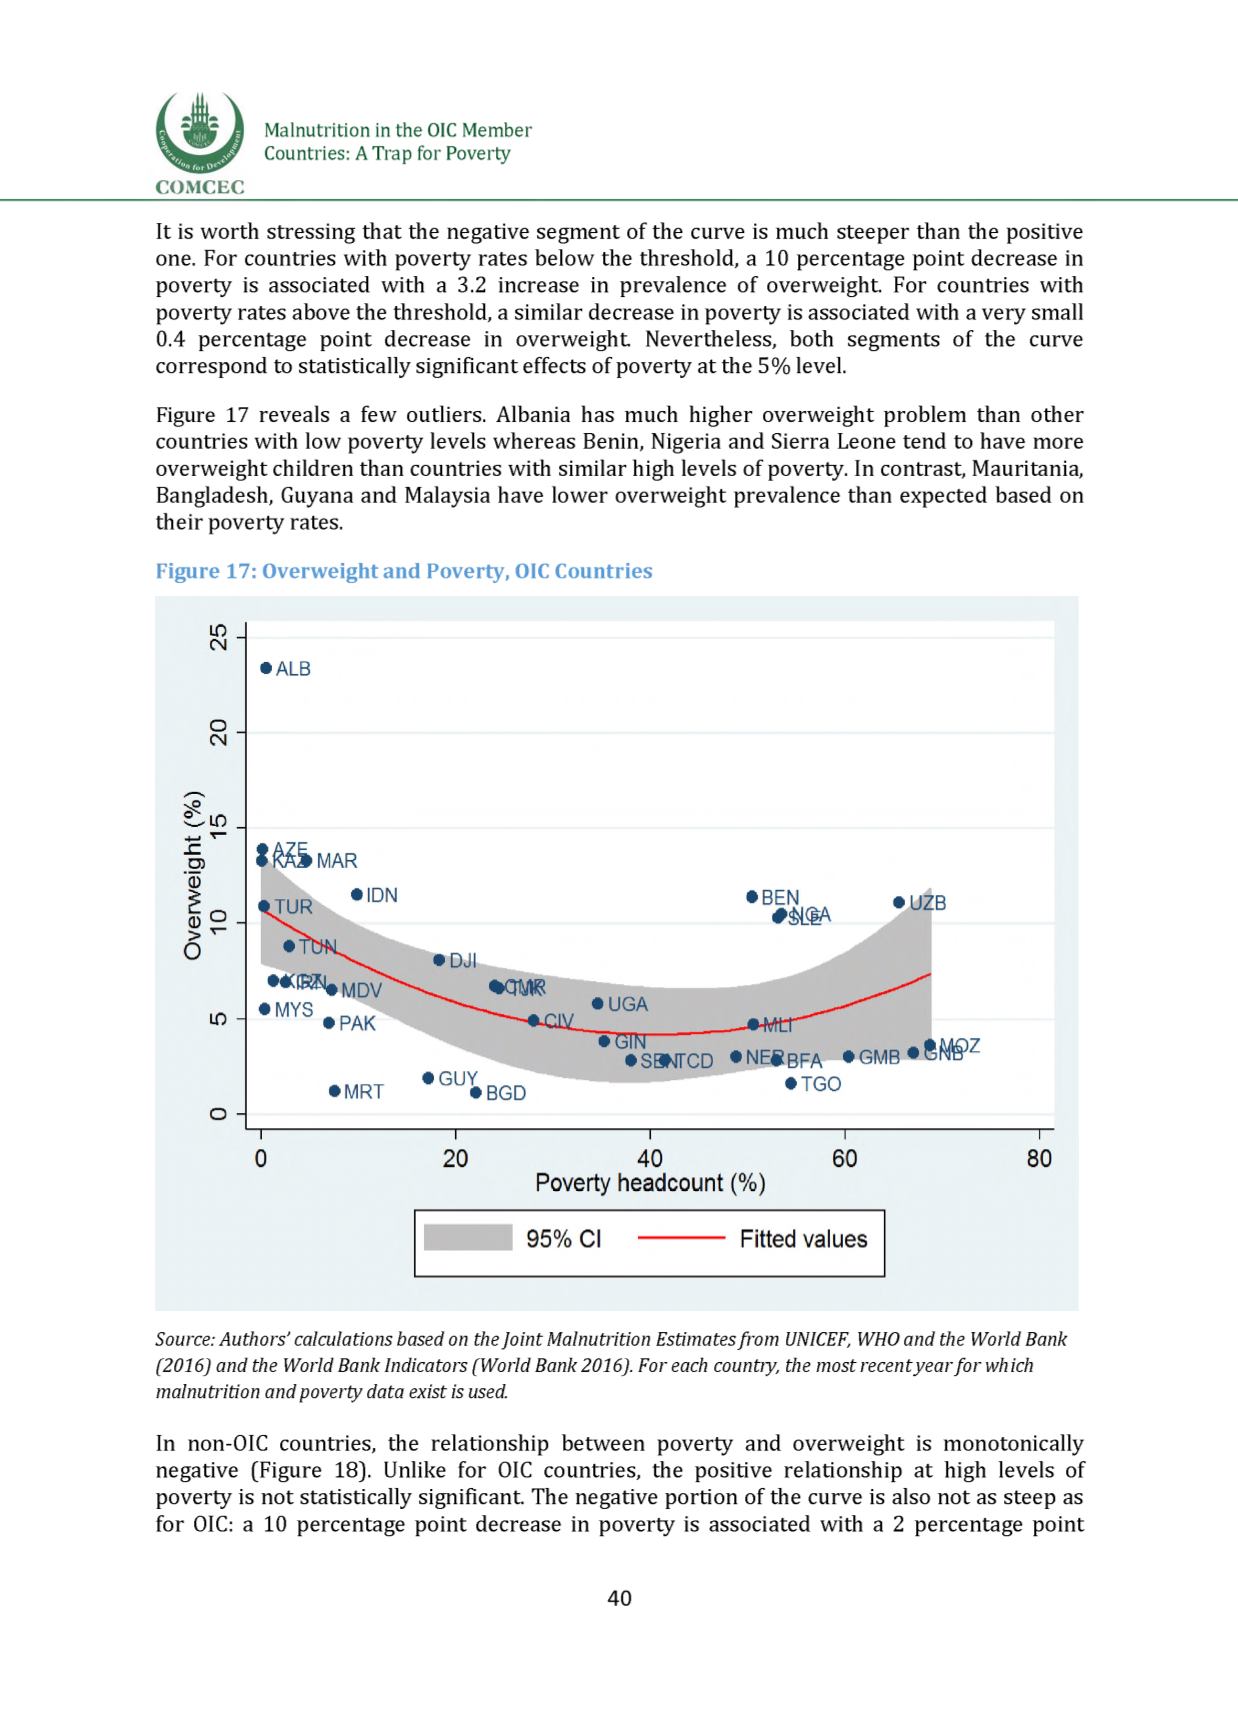
It is worth stressing that the negative segment of the curve is much steeper than the positive
one. For countries with poverty rates below the threshold, a 10 percentage point decrease in
poverty is associated with a 3.2 increase in prevalence of overweight. For countries with
poverty rates above the threshold, a similar decrease in poverty is associated with a very small
0.4 percentage point decrease in overweight. Nevertheless, both segments of the curve
correspond to statistically significant effects of poverty at the 5% level.
Figure 17 reveals a few outliers. Albania has much higher overweight problem than other
countries with low poverty levels whereas Benin, Nigeria and Sierra Leone tend to have more
overweight children than countries with similar high levels of poverty. In contrast, Mauritania,
Bangladesh, Guyana and Malaysia have lower overweight prevalence than expected based on
their poverty rates.
Figure 17: Overweight and Poverty, OICCountries
Source: Authors' calculations based on theJoint Malnutrition Estimatesfrom UNICEF, WHOand the World Bank
(2016) and the World Bank Indicators (World Bank 2016). For each country, the most recentyearfor which
malnutrition and poverty data exist is used.
In non-OIC countries, the relationship between poverty and overweight is monotonically
negative
(Figure 18).Unlike for OIC countries, the positive relationship at high levels of
poverty is not statistically significant. The negative portion of the curve is also not as steep as
for OIC: a 10 percentage point decrease in poverty is associated with a 2 percentage point
40


