
Malnutrition in the OIC Member
Countries: A Trap for Poverty
COMCEC
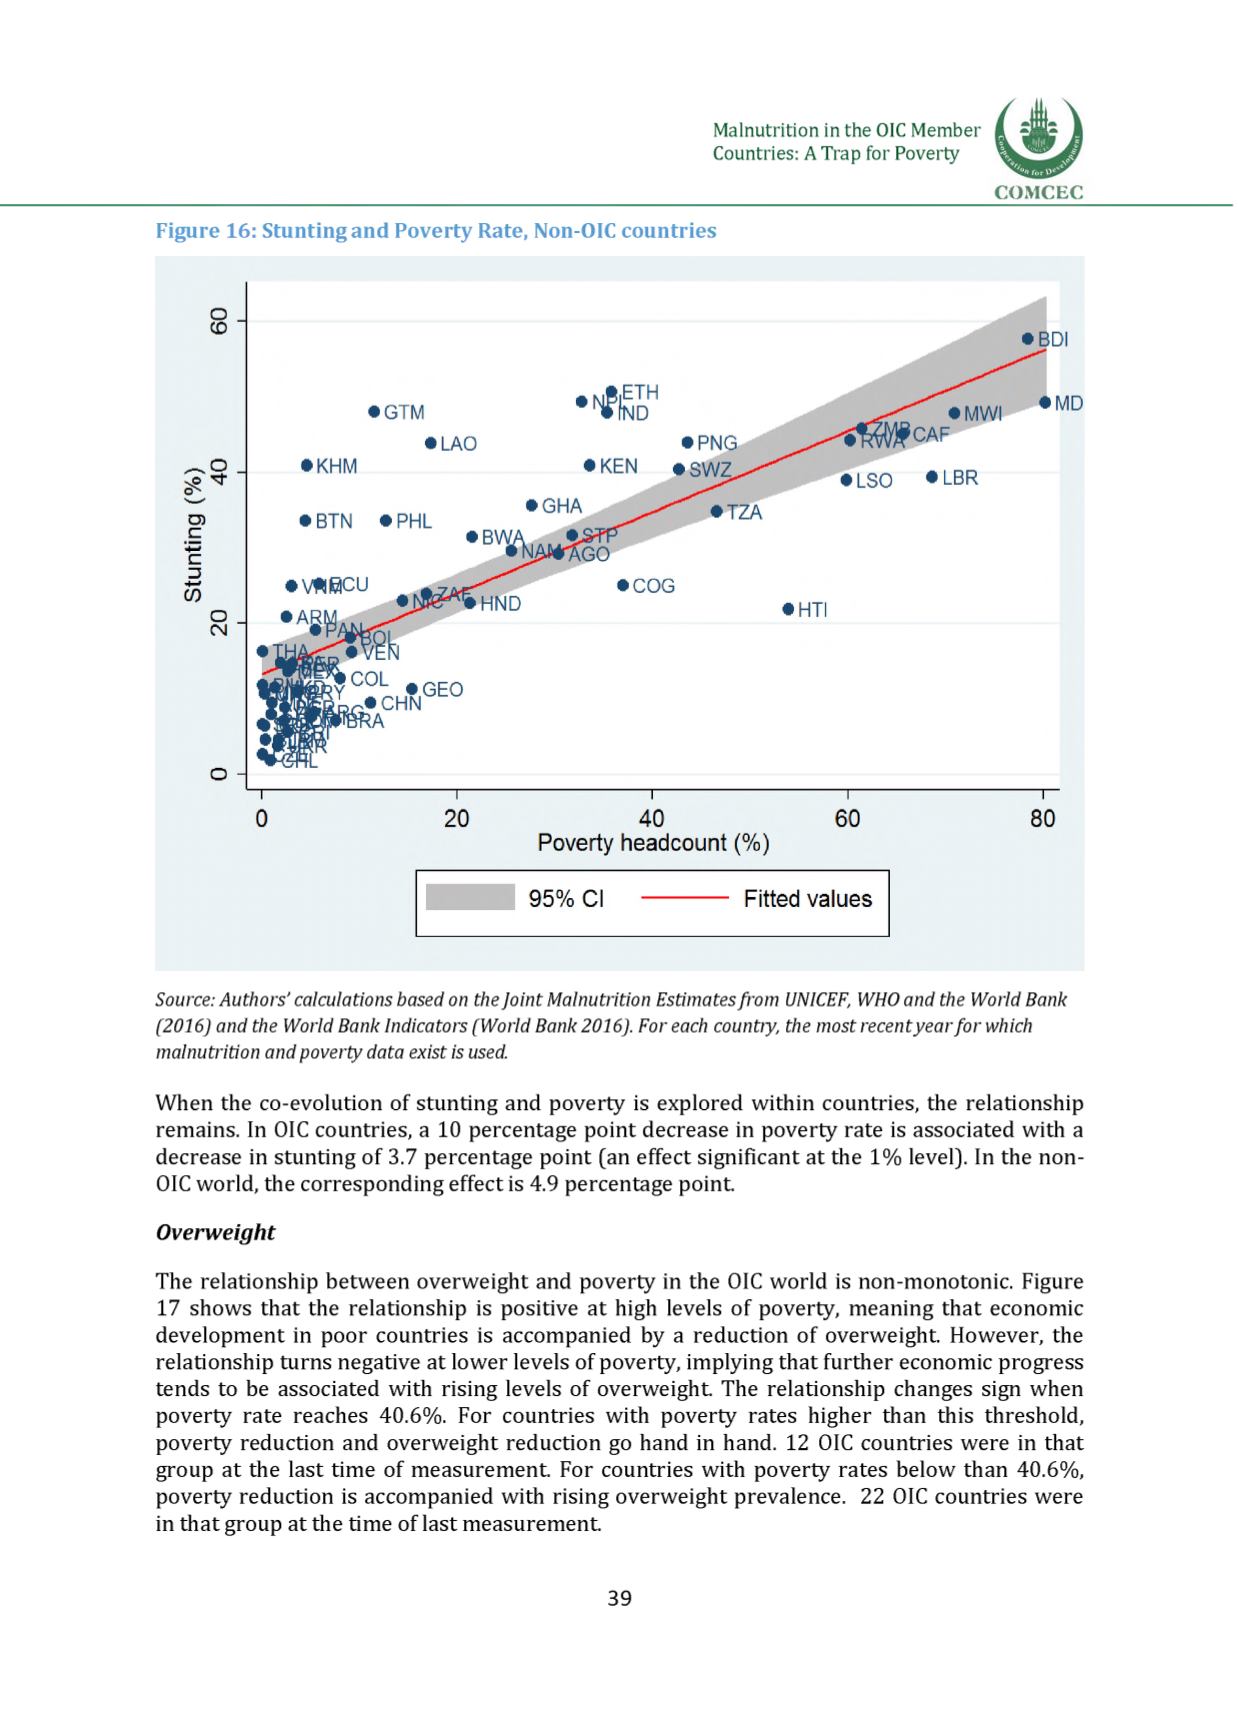
Figure 16: Stunting and Poverty Rate, Non-OIC countries
Source: Authors' calculations based on theJoint Malnutrition Estimatesfrom UNICEF, WHOand the World Bank
(2016) and the World Bank Indicators (World Bank 2016). For each country, the most recentyearfor which
malnutrition and poverty data exist is used.
When the co-evolution of stunting and poverty is explored within countries, the relationship
remains. In OIC countries, a 10 percentage point decrease in poverty rate is associated with a
decrease in stunting of 3.7 percentage point (an effect significant at the 1% level). In the non-
OICworld, the corresponding effect is 4.9 percentage point.
Overweight
The relationship between overweight and poverty in the OIC world is non-monotonic
. Figure 17 shows that the relationship is positive at high levels of poverty, meaning that economic
development in poor countries is accompanied by a reduction of overweight. However, the
relationship turns negative at lower levels of poverty, implying that further economic progress
tends to be associated with rising levels of overweight. The relationship changes sign when
poverty rate reaches 40.6%. For countries with poverty rates higher than this threshold,
poverty reduction and overweight reduction go hand in hand. 12 OIC countries were in that
group at the last time of measurement. For countries with poverty rates below than 40.6%,
poverty reduction is accompanied with rising overweight prevalence. 22 OIC countries were
in that group at the time of last measurement.
39


