


 41 / 164

Malnutrition in the OIC Member
Countries: A Trap for Poverty
COMCEC
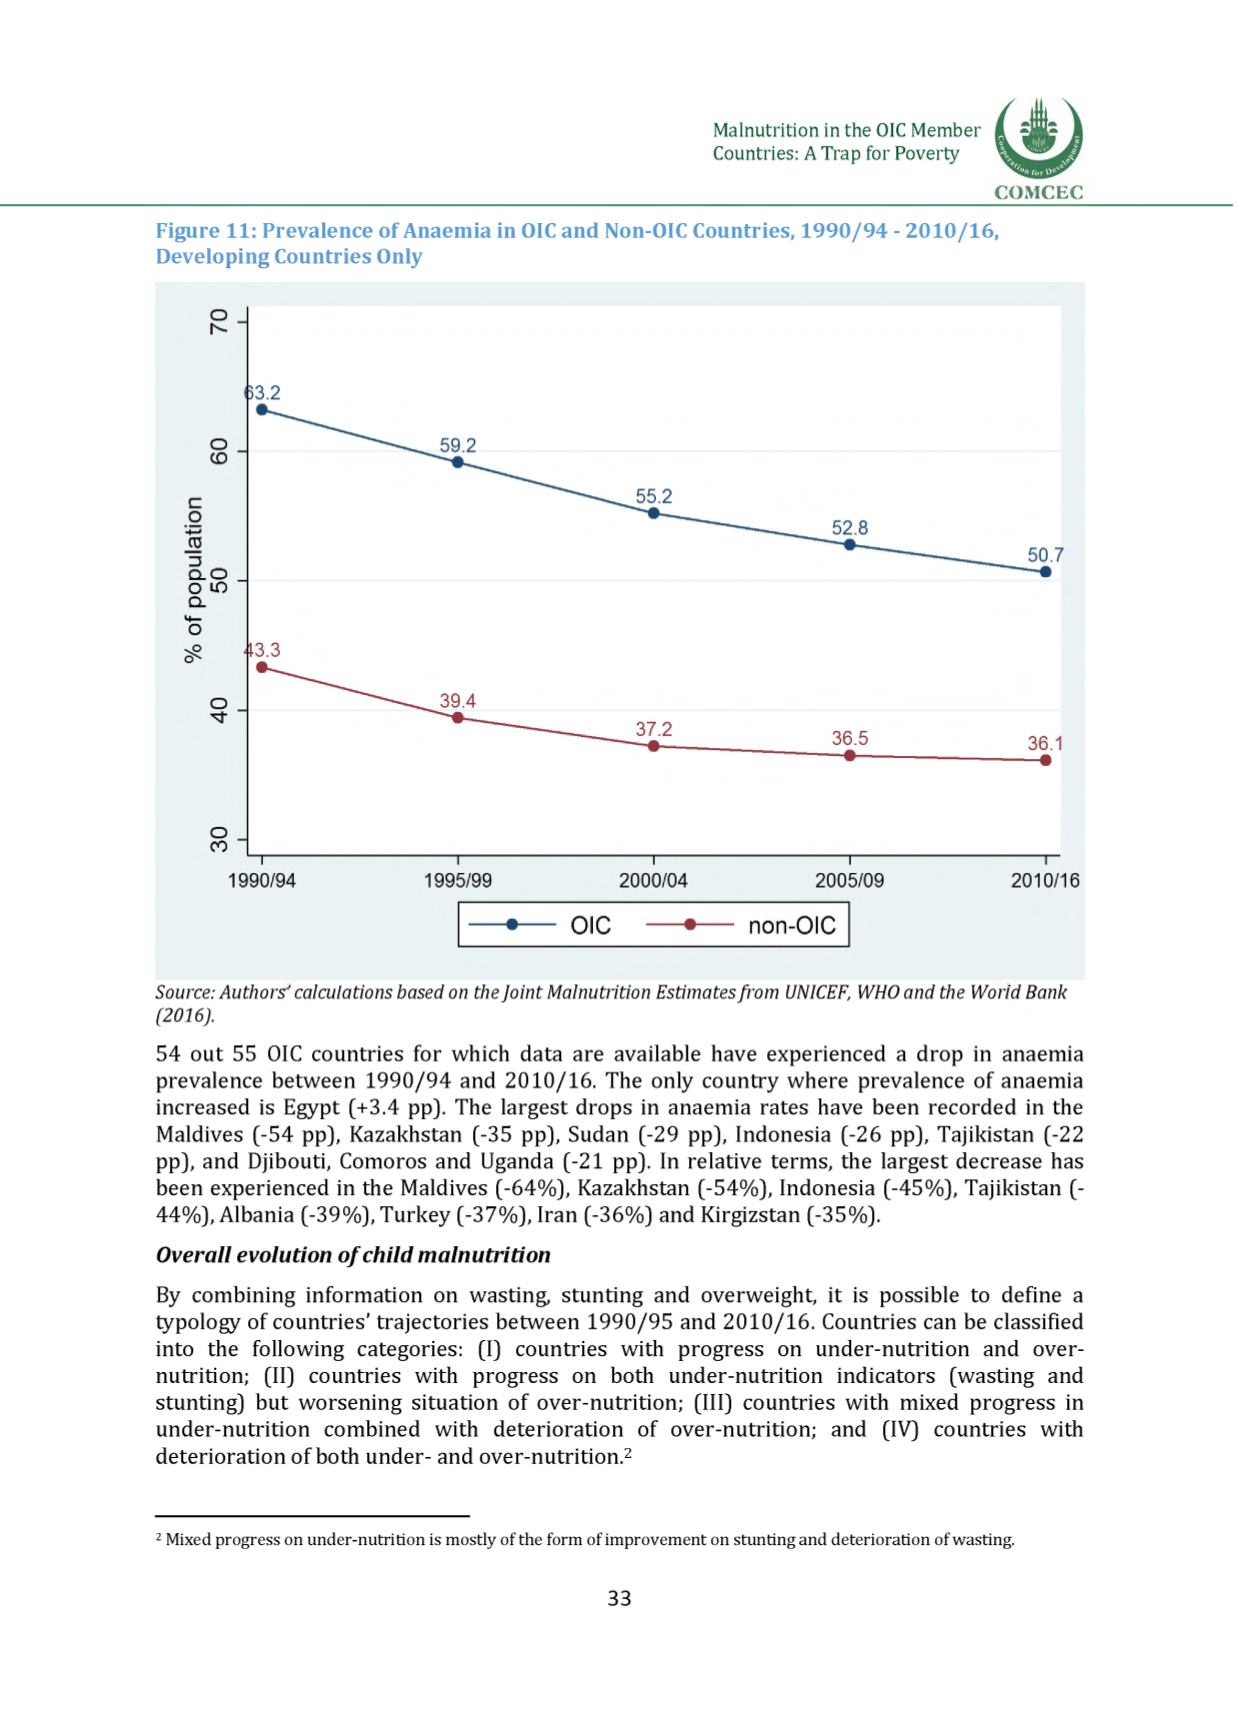
Figure 11: Prevalence ofAnaemia in OICand Non-OIC Countries, 1990 /94 - 2010/16,
Developing Countries Only
Source: Authors calculations based on theJoint Malnutrition Estimatesfrom UNICEF, WHOand the World Bank
(2016).
54 out 55 OIC countries for which data are available have experienced a drop in anaemia
prevalence between 1990/94 and 2010/16. The only country where prevalence of anaemia
increased is Egypt (+3.4 pp). The largest drops in anaemia rates have been recorded in the
Maldives (-54 pp), Kazakhstan (-35 pp), Sudan (-29 pp), Indonesia (-26 pp), Tajikistan (-22
pp), and Djibouti, Comoros and Uganda (-21 pp). In relative terms, the largest decrease has
been experienced in the Maldives (-64%), Kazakhstan (-54%), Indonesia (-45%), Tajikistan (44%), Albania (-39%), Turkey (-37%), Iran (-36%) and Kirgizstan (-35%).
Overall evolution of child malnutrition
By combining information on wasting, stunting and overweight, it is possible to define a
typology of countries' trajectories between 1990/95 and 2010/16. Countries can be classified
into the following categories: (I) countries with progress on under-nutrition and over
nutrition; (II) countries with progress on both under-nutrition indicators (wasting and
stunting) but worsening situation of over-nutrition; (III) countries with mixed progress in
under-nutrition combined with deterioration of over-nutrition; and (IV) countries with
deterioration of both under- and over-nutrition.2
2Mixed progress on under-nutrition is mostly of the form of improvement on stunting and deterioration of wasting.
33