
Malnutrition in the OIC Member
Countries: A Trap for Poverty
COMCEC
Overweight
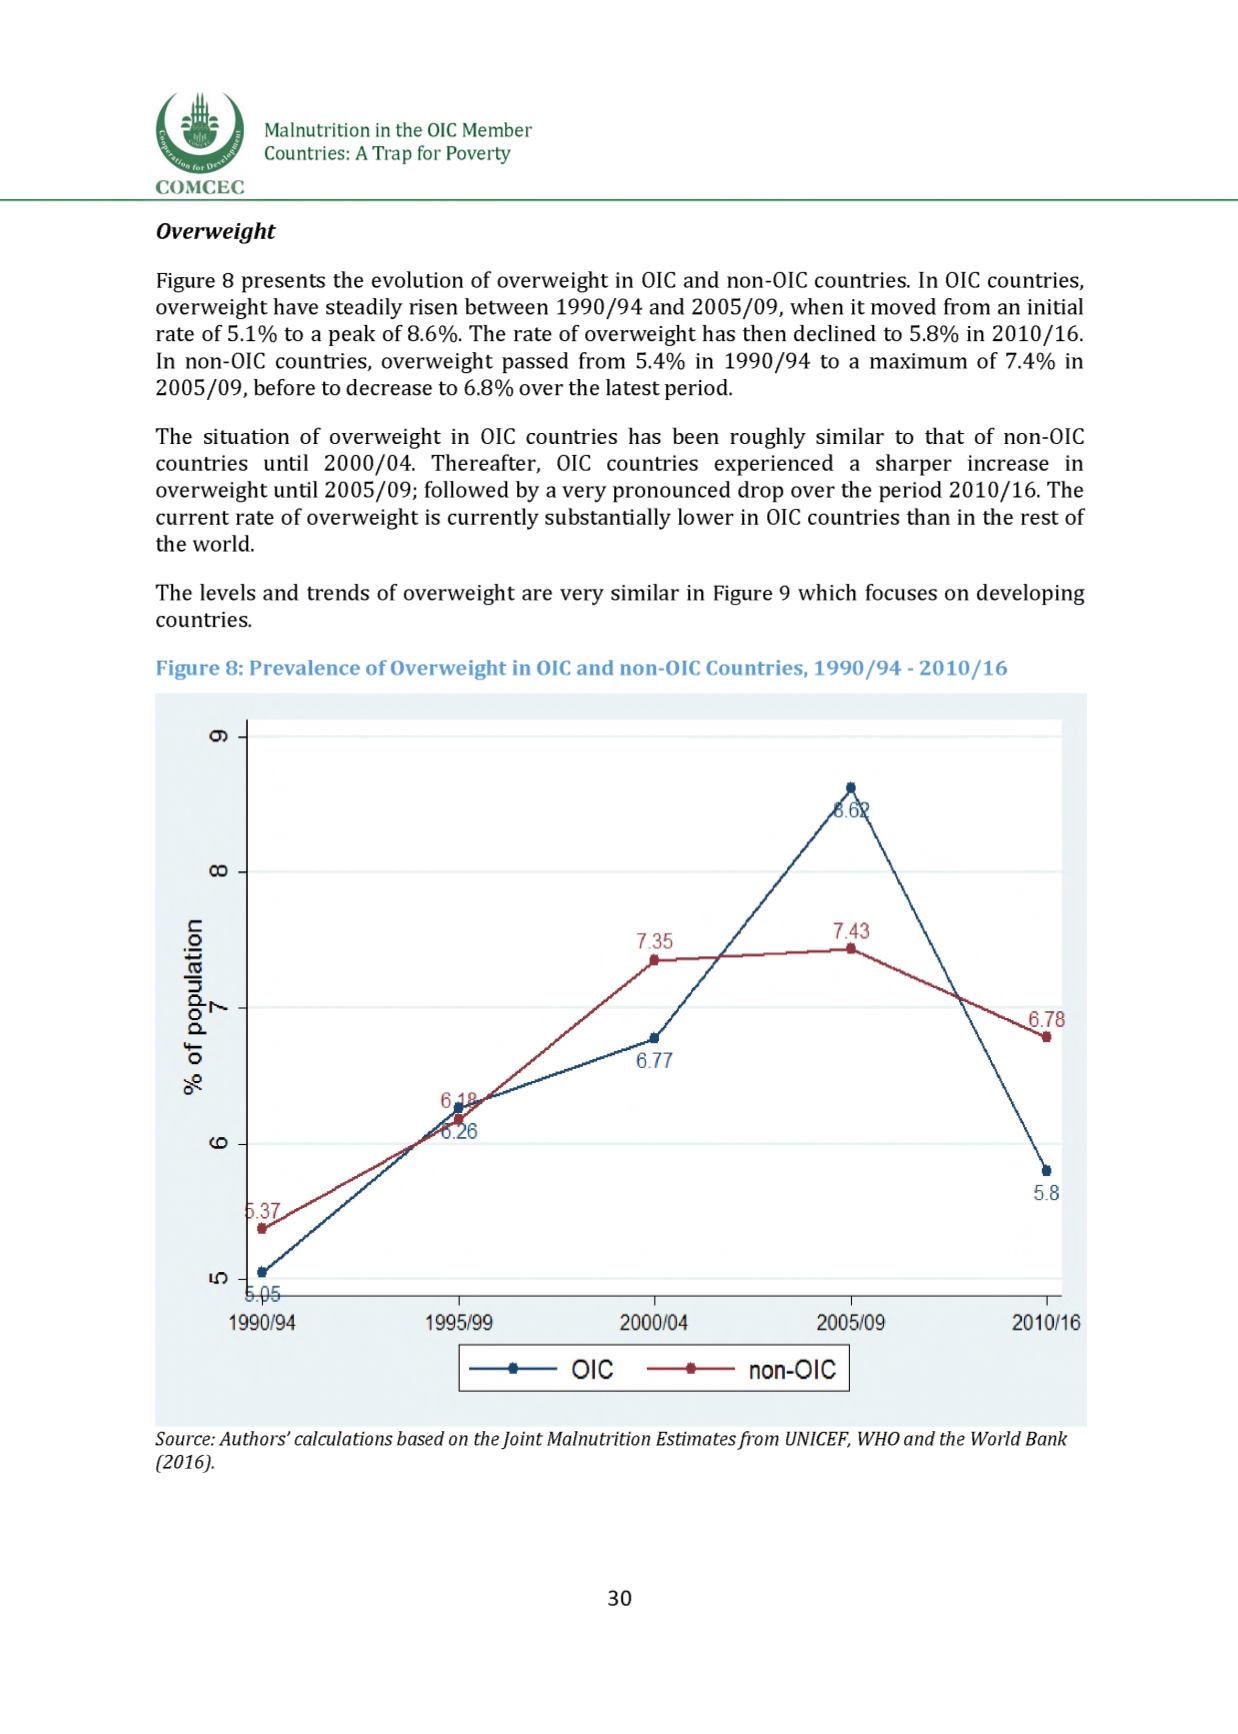
Figure 8 presents the evolution of overweight in OIC and non-OIC countries. In OIC countries,
overweight have steadily risen between 1990/94 and 2005/09, when it moved from an initial
rate of 5.1% to a peak of 8.6%. The rate of overweight has then declined to 5.8% in 2010/16.
In non-OIC countries, overweight passed from 5.4% in 1990/94 to a maximum of 7.4% in
2005/09, before to decrease to 6.8% over the latest period.
The situation of overweight in OIC countries has been roughly similar to that of non-OIC
countries until 2000/04. Thereafter, OIC countries experienced a sharper increase in
overweight until 2005/09; followed by a very pronounced drop over the period 2010/16. The
current rate of overweight is currently substantially lower in OIC countries than in the rest of
the world.
The levels and trends of overweight are very similar i
n Figure 9which focuses on developing
countries.
Figure 8: Prevalence of Overweight in OICand non-OIC Countries, 1990 /94 - 2010 /16
Source: Authors' calculations based on theJoint Malnutrition Estimatesfrom UNICEF, WHOand the World Bank
(2016).
30


