
Malnutrition in the OIC Member
Countries: A Trap for Poverty
COMCEC
Table 21 in annex Apresents the evolution of wasting for all OIC countries.
Finally, it is worth noting that many countries have not had a uniform evolution of wasting.
Djibouti, Algeria, Mali, Syria, Togo, Azerbaijan, or Nigeria, for instance, have seen several
changes in trend. Such discontinuities reflect the sensitivity of the wasting indicator to short
term changes, positive or negative
. Figure 37 an
d Figure 38 show the evolution of wasting for
all OIC countries.
Stunting
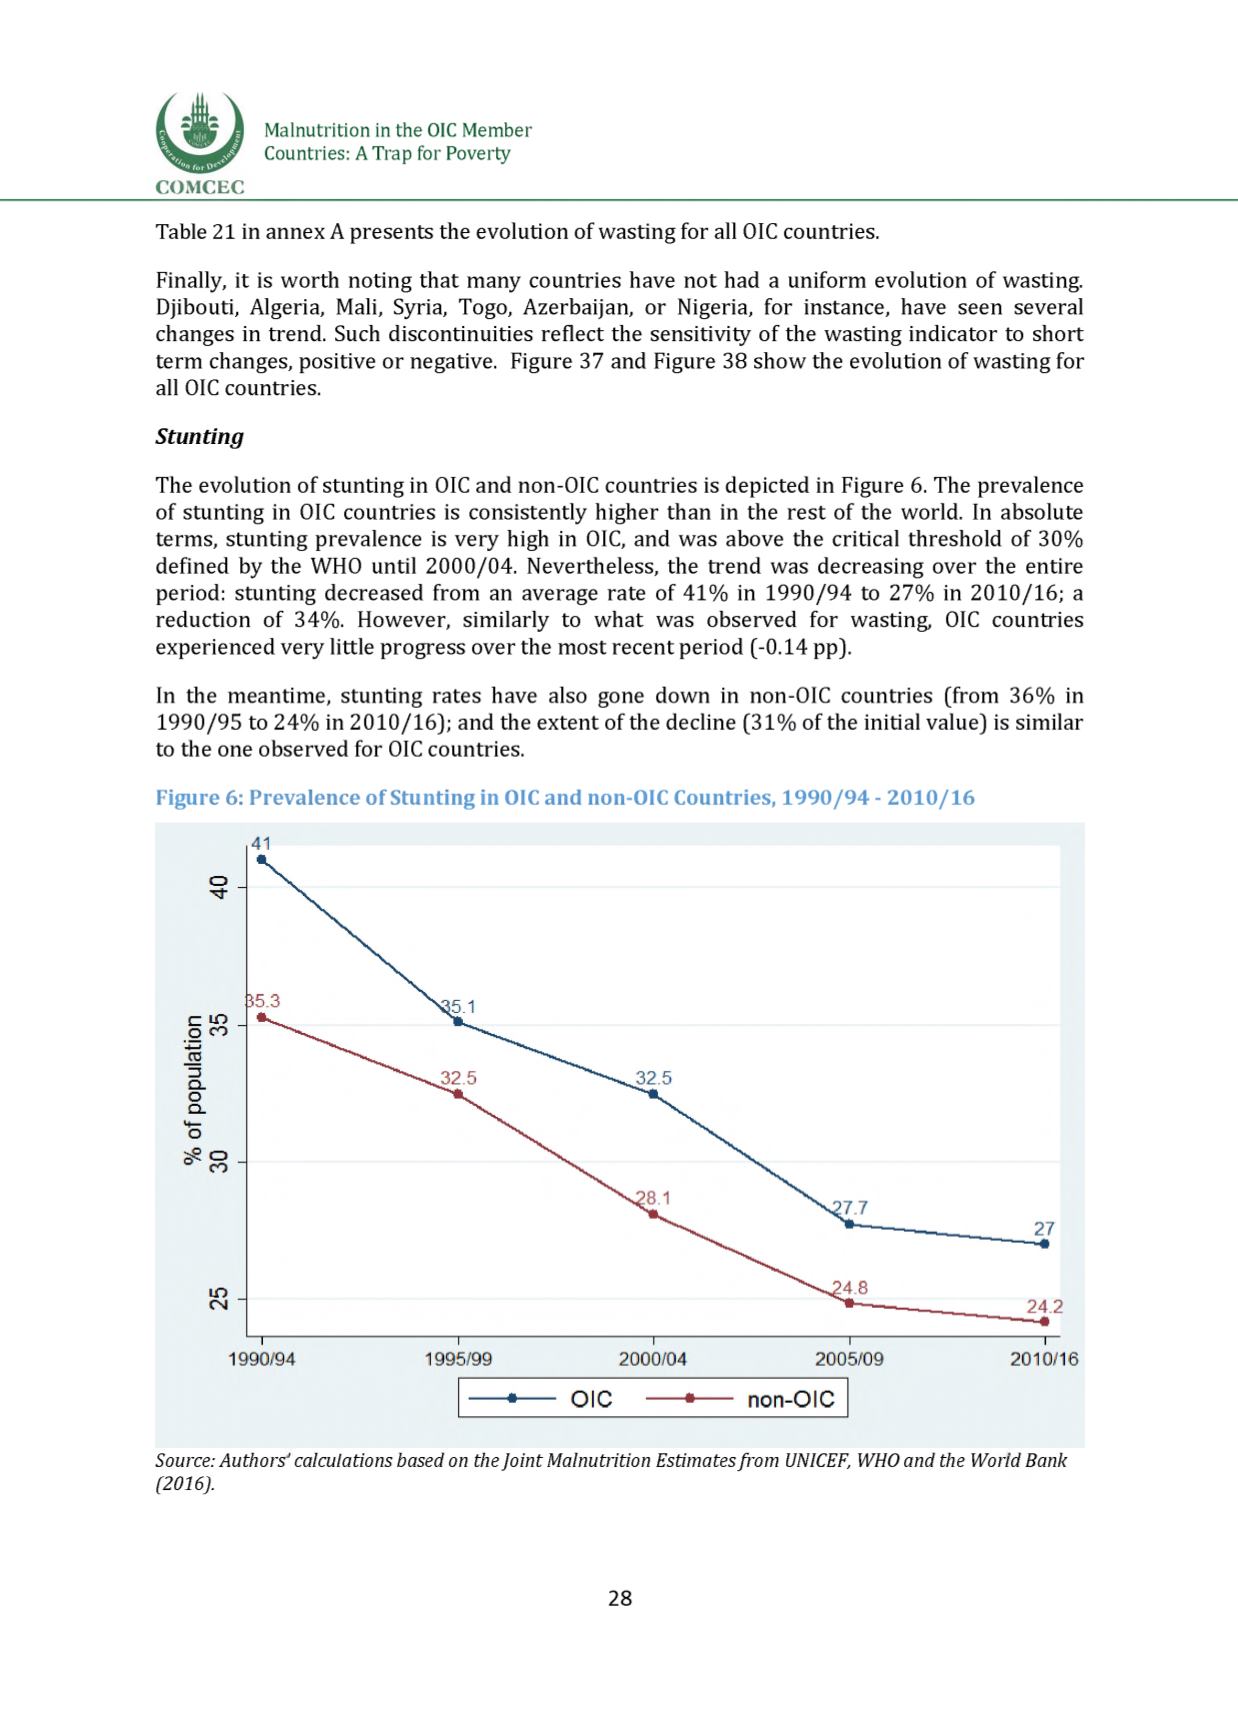
The evolution of stunting in OIC and non-OIC countries is depicted i
n Figure 6. The prevalence
of stunting in OIC countries is consistently higher than in the rest of the world. In absolute
terms, stunting prevalence is very high in OIC, and was above the critical threshold of 30%
defined by the WHO until 2000/04. Nevertheless, the trend was decreasing over the entire
period: stunting decreased from an average rate of 41% in 1990/94 to 27% in 2010/16; a
reduction of 34%. However, similarly to what was observed for wasting, OIC countries
experienced very little progress over the most recent period (-0.14 pp).
In the meantime, stunting rates have also gone down in non-OIC countries (from 36% in
1990/95 to 24% in 2010/16); and the extent of the decline (31% of the initial value) is similar
to the one observed for OIC countries.
Figure 6: Prevalence of Stunting in OICand non-OIC Countries, 1990 /94 - 2010 /16
Source: Authors calculations based on theJoint Malnutrition Estimatesfrom UNICEF, WHOand the World Bank
(2016).
28


