


 37 / 164

Malnutrition in the OIC Member
Countries: A Trap for Poverty
COMCEC
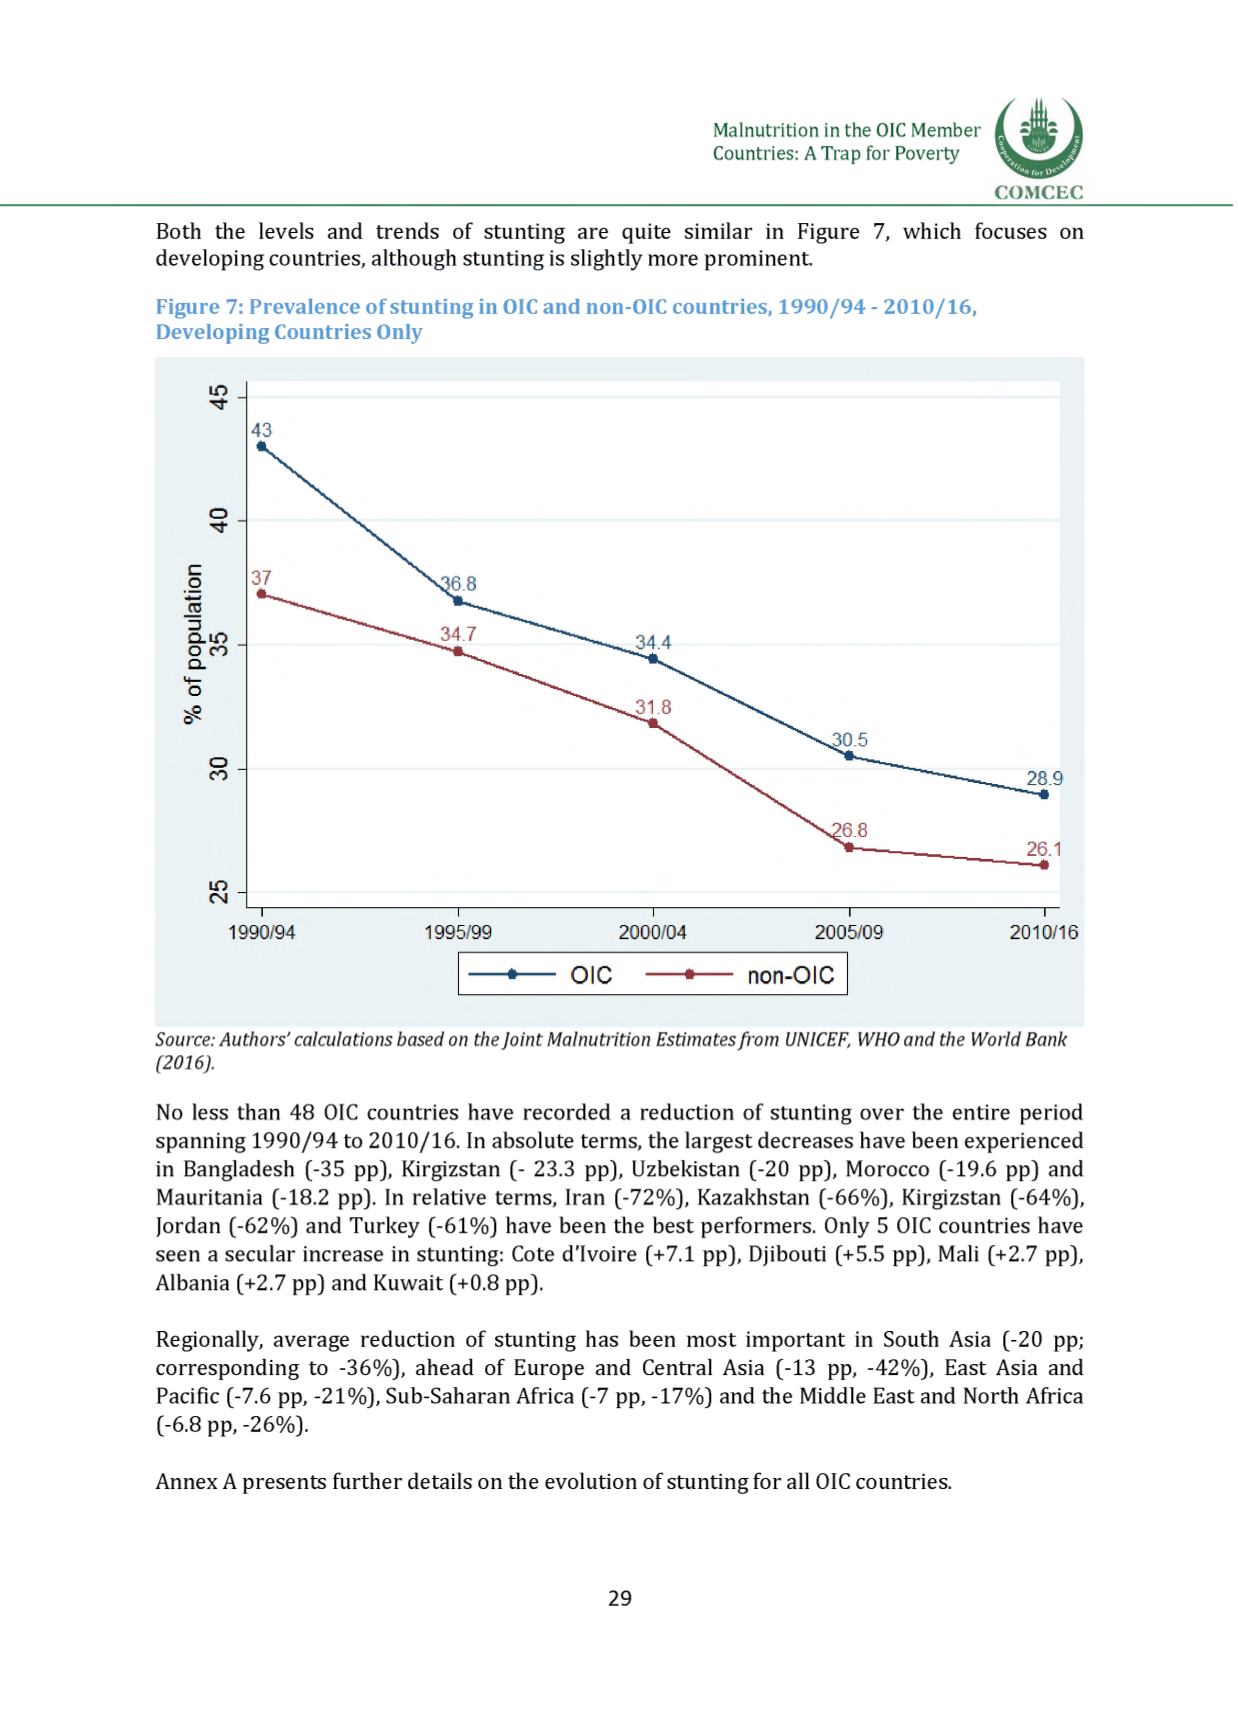
Both the levels and trends of stunting are quite similar i
n Figure 7, which focuses on
developing countries, although stunting is slightly more prominent.
Figure 7: Prevalence of stunting in OICand non-OIC countries, 1990 /94 - 2010/16,
Developing Countries Only
Source: Authors' calculations based on theJoint Malnutrition Estimatesfrom UNICEF, WHOand the World Bank
(2016).
No less than 48 OIC countries have recorded a reduction of stunting over the entire period
spanning 1990/94 to 2010/16. In absolute terms, the largest decreases have been experienced
in Bangladesh (-35 pp), Kirgizstan (- 23.3 pp), Uzbekistan (-20 pp), Morocco (-19.6 pp) and
Mauritania (-18.2 pp). In relative terms, Iran (-72%), Kazakhstan (-66%), Kirgizstan (-64%),
Jordan (-62%) and Turkey (-61%) have been the best performers. Only 5 OIC countries have
seen a secular increase in stunting: Cote d'Ivoire (+7.1 pp], Djibouti (+5.5 pp), Mali (+2.7 pp),
Albania (+2.7 pp) and Kuwait (+0.8 pp).
Regionally, average reduction of stunting has been most important in South Asia (-20 pp;
corresponding to -36%), ahead of Europe and Central Asia (-13 pp, -42%), East Asia and
Pacific (-7.6 pp, -21%), Sub-Saharan Africa (-7 pp, -17%) and the Middle East and North Africa
(-6.8 pp, -26%).
Annex Apresents further details on the evolution of stunting for all OIC countries.
29