


 35 / 164

Malnutrition in the OIC Member
Countries: A Trap for Poverty
COMCEC
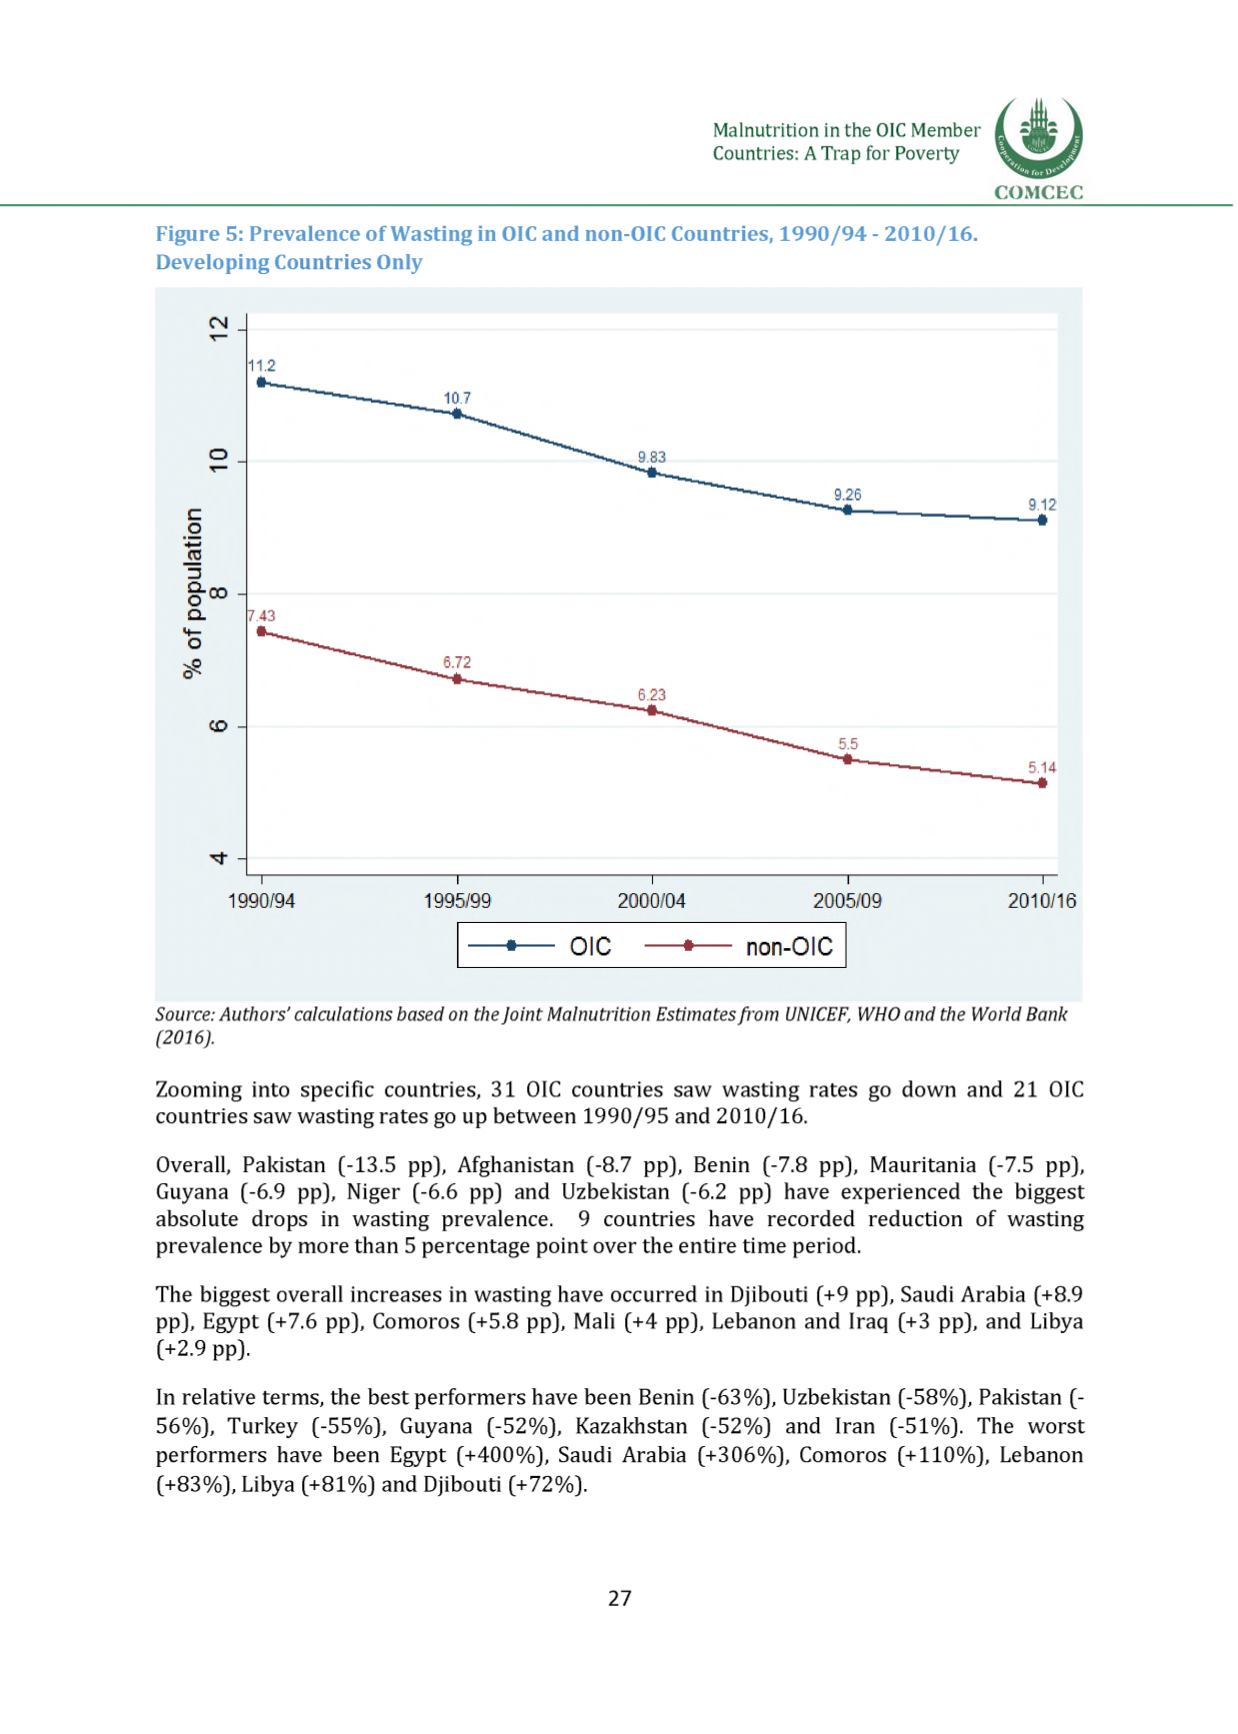
Figure 5: Prevalence ofWasting in OICand non-OIC Countries, 1990 /94 - 2010/16.
Developing Countries Only
Source: Authors' calculations based on theJoint Malnutrition Estimatesfrom UNICEF, WHOand the World Bank
(2016).
Zooming into specific countries, 31 OIC countries saw wasting rates go down and 21 OIC
countries saw wasting rates go up between 1990/95 and 2010/16.
Overall, Pakistan (-13.5 pp), Afghanistan (-8.7 pp), Benin (-7.8 pp), Mauritania (-7.5 pp),
Guyana (-6.9 pp), Niger (-6.6 pp) and Uzbekistan (-6.2 pp) have experienced the biggest
absolute drops in wasting prevalence. 9 countries have recorded reduction of wasting
prevalence by more than 5 percentage point over the entire time period.
The biggest overall increases in wasting have occurred in Djibouti (+9 pp), Saudi Arabia (+8.9
pp), Egypt (+7.6 pp), Comoros (+5.8 pp), Mali (+4 pp), Lebanon and Iraq (+3 pp), and Libya
(+2.9 pp).
In relative terms, the best performers have been Benin (-63%), Uzbekistan (-58%), Pakistan (56%), Turkey (-55%), Guyana (-52%), Kazakhstan (-52%) and Iran (-51%). The worst
performers have been Egypt (+400%), Saudi Arabia (+306%), Comoros (+110%), Lebanon
(+83%), Libya (+81%) and Djibouti (+72%).
27