


 33 / 164

Malnutrition in the OIC Member
Countries: A Trap for Poverty
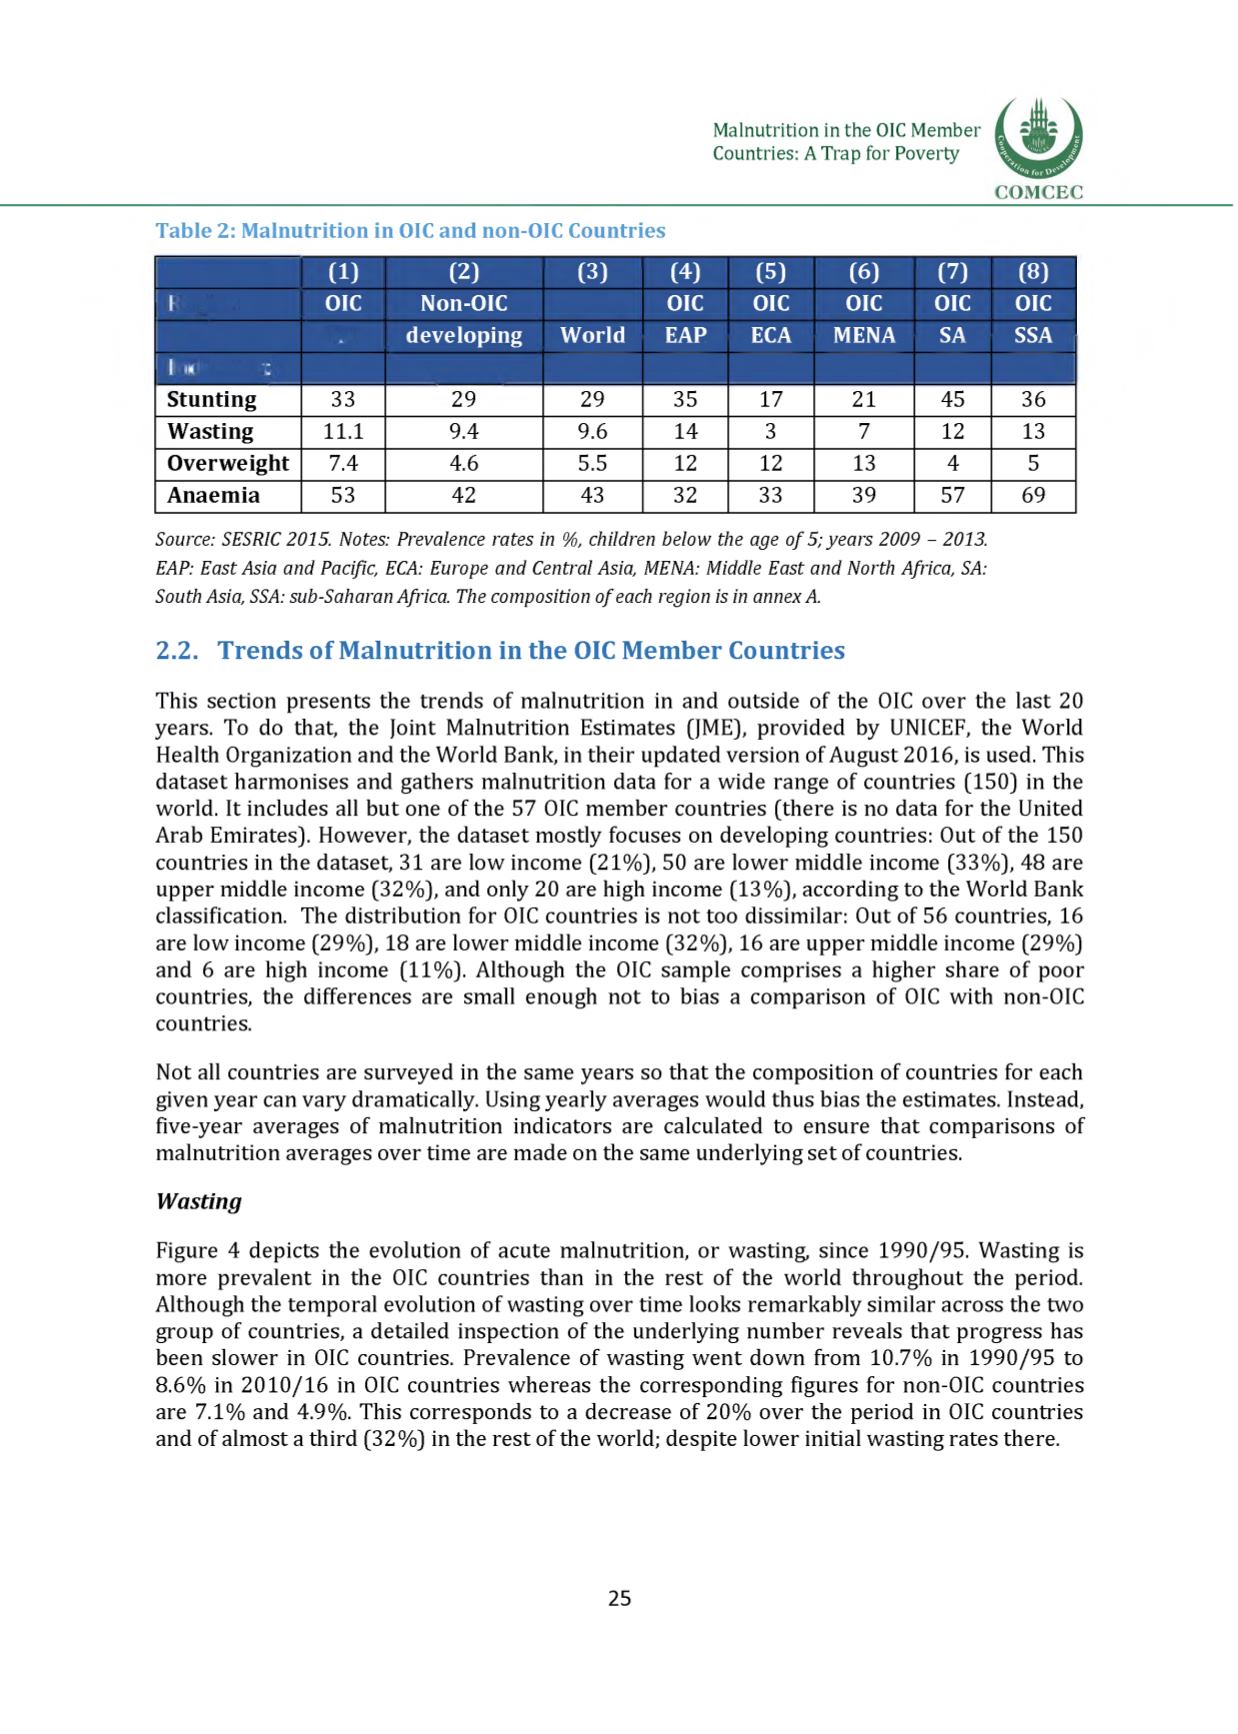
Table 2: Malnutrition in OICand non-OIC Countries
(1)
(2)
(3)
(4)
(5)
(6)
(7)
(8)
Region
OIC Non-OIC
OIC OIC OIC OIC OIC
All
developing World EAP ECA MENA SA SSA
Indicator:
Stunting
33
29
29
35
17
21
45
36
Wasting
11.1
9.4
9.6
14
3
7
12
13
Overweight
7.4
4.6
5.5
12
12
13
4
5
Anaemia
53
42
43
32
33
39
57
69
Source: SESRIC 2015. Notes: Prevalence rates in %, children below the age of 5 ;years 2009 - 2013.
EAP: East Asia and Pacific, ECA: Europe and Central Asia, MENA: Middle East and North Africa, SA:
South Asia, SSA: sub-Saharan Africa. The composition of each region is in annex A.
2.2. Trends of Malnutrition in the OIC Member Countries
This section presents the trends of malnutrition in and outside of the OIC over the last 20
years. To do that, the Joint Malnutrition Estimates (JME), provided by UNICEF, the World
Health Organization and the World Bank, in their updated version of August 2016, is used. This
dataset harmonises and gathers malnutrition data for a wide range of countries (150) in the
world. It includes all but one of the 57 OIC member countries (there is no data for the United
Arab Emirates). However, the dataset mostly focuses on developing countries: Out of the 150
countries in the dataset, 31 are low income (21%), 50 are lower middle income (33%), 48 are
upper middle income (32%), and only 20 are high income (13%), according to the World Bank
classification. The distribution for OIC countries is not too dissimilar: Out of 56 countries, 16
are low income (29%), 18 are lower middle income (32%), 16 are upper middle income (29%)
and 6 are high income (11%). Although the OIC sample comprises a higher share of poor
countries, the differences are small enough not to bias a comparison of OIC with non-OIC
countries.
Not all countries are surveyed in the same years so that the composition of countries for each
given year can vary dramatically. Using yearly averages would thus bias the estimates. Instead,
five-year averages of malnutrition indicators are calculated to ensure that comparisons of
malnutrition averages over time are made on the same underlying set of countries.
Wasting
Figure 4 depicts the evolution of acute malnutrition, or wasting, since 1990/95. Wasting is
more prevalent in the OIC countries than in the rest of the world throughout the period.
Although the temporal evolution of wasting over time looks remarkably similar across the two
group of countries, a detailed inspection of the underlying number reveals that progress has
been slower in OIC countries. Prevalence of wasting went down from 10.7% in 1990/95 to
8.6% in 2010/16 in OIC countries whereas the corresponding figures for non-OIC countries
are 7.1% and 4.9%. This corresponds to a decrease of 20% over the period in OIC countries
and of almost a third (32%) in the rest of the world; despite lower initial wasting rates there.
25