


 25 / 108

18
Chapter 3: Current Level of Access to Health Services and its
trends in the OIC Member Countries
This chapter presents the current status and trend of access to health indicators in the OIC countries
over the last 20 years. To do that, health data published by the World Bank in their updated version of
November 2018, is used.
3
The data in this database is sourced from UNICEF, various UN agencies,
DHS/MICS, and may include World Bank staff estimates based on other sources.
Not all countries are covered in the same years within the World Bank’s health database. As a result,
the composition of countries for each given year can vary dramatically. This becomes a serious
problem when comparing annual averages for various indicators through time. So, we calculated five-
year (instead of annual) weighted averages to ensure that comparisons of averages over time are made
on the same underlying set of countries. To do this, first we selected the latest available observation
for every country within each of the 5-year periods, then used those observations to calculate the
average for that period. For example, the average for a given indicator for the period 2011-2015 would
include data from 2015, from 2014, etc. for different countries depending on the latest available data
for each country within the period. We used population estimates as weights when calculating the 5-
year weighted averages. This approach was used to calculate weighted averages across multiple
groups of countries: OIC member countries, non-OIC countries, countries belonging to three World
Bank income groups, and countries in the three geographic groupings within the OIC, namely the
African group, the Arab group and the Asian group.
We use several widely monitored indicators to map out the current status (as reflected in latest
available data) and historical trends in access to health services in the OIC countries. Thematic maps
outline the current status and its geographic dispersion while tables tabulate 5-yearly weighted
averages which are used to trace trends within the last 20 years.
3.1.
Trends of health outcomes in the OIC Member Countries vis-à-vis the rest of
the world
This section presents the trends in and outside of the OIC over the last 20 years. OIC and non-OIC
countries within theWorld Bank health dataset are distributed across various income groups as shown
in
Table 2 .The trend analysis and OIC vs. non-OIC comparison in this section will primarily focus on
low-income and middle-income countries. This means that seven high-income OIC countries and 73
other high-income non-OIC countries are not covered here.
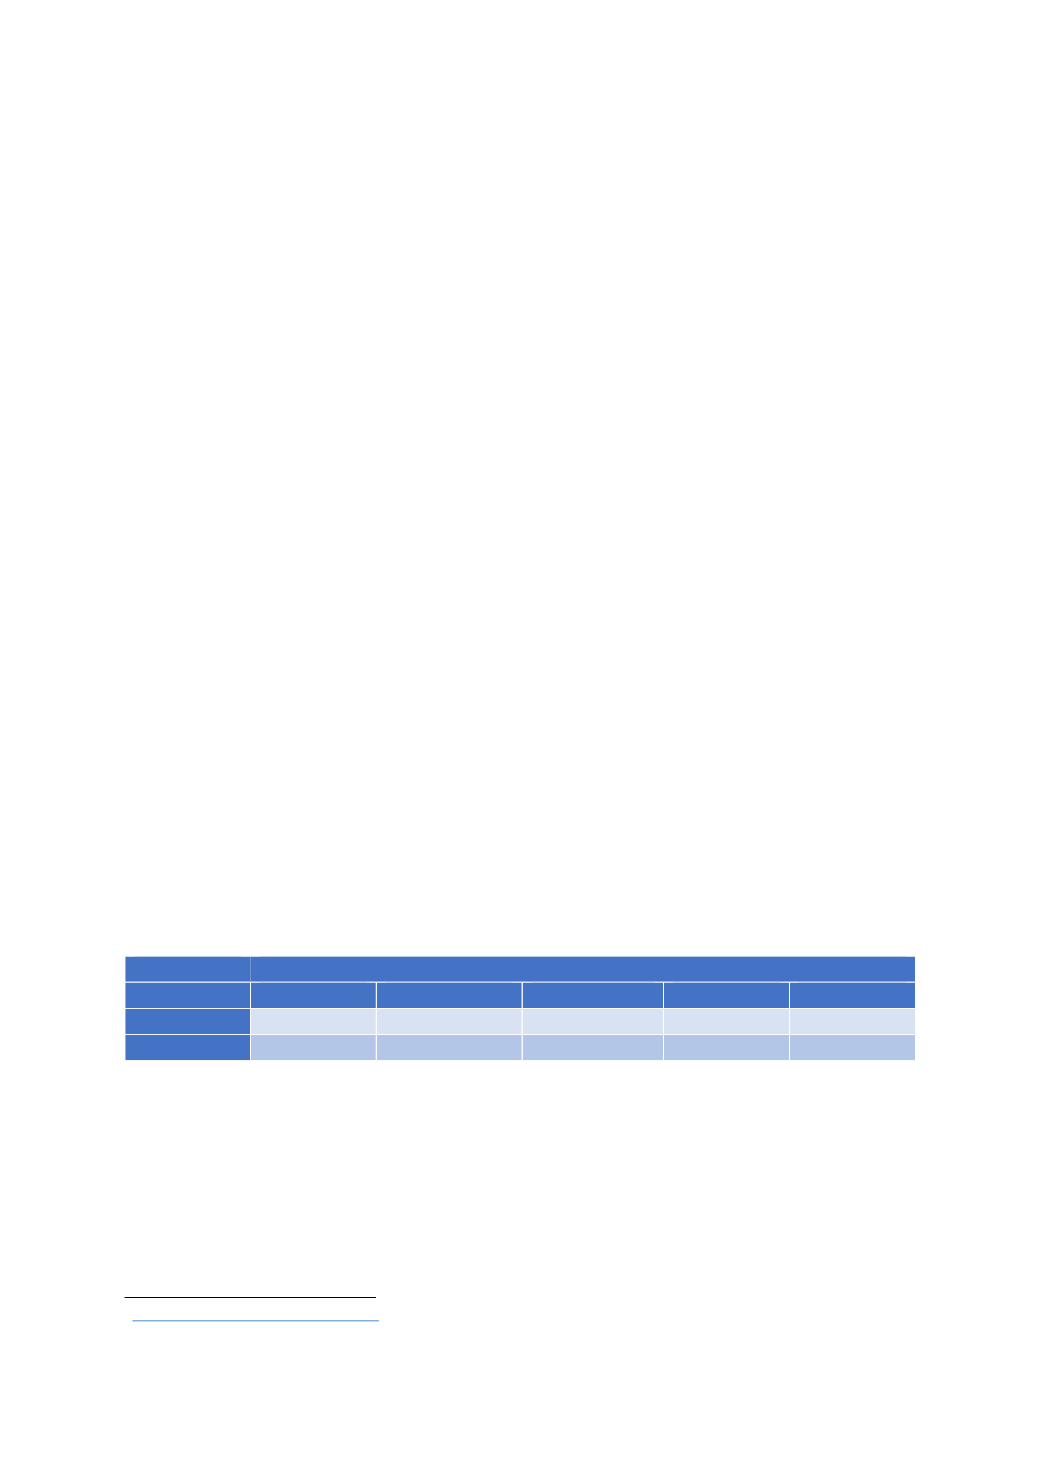
Table 2: Number of OIC and non-OIC countries in World Bank Health Dataset
World Bank income groups
High
Upper middle
Lower middle
Low
Total
OIC
7
16
15
19
57
non-OIC
73
40
32
15
160
Source: authors’ calculations.
Figure 11 uses bar graphs to examine trends of demand for health services using six selected
indicators, which are (i) life expectancy at birth, (ii) maternal mortality rate, (iii) under five mortality
rate, (iv) mortality from non-communicable diseases, (v) incidence of tuberculosis, and (vi) incidence
of HIV. The graph plots the weighted average of the selected indicators for six sub-groups of countries:
low income OIC countries, low income non-OIC countries, lower middle income OIC countries, lower
middle income non-OIC countries, upper middle income OIC countries, and upper middle income non-
OIC countries. For each of the income-OIC subgroups weighted average of the relevant indicator was
3 https://data.worldbank.org/topic/health