


 30 / 108

23
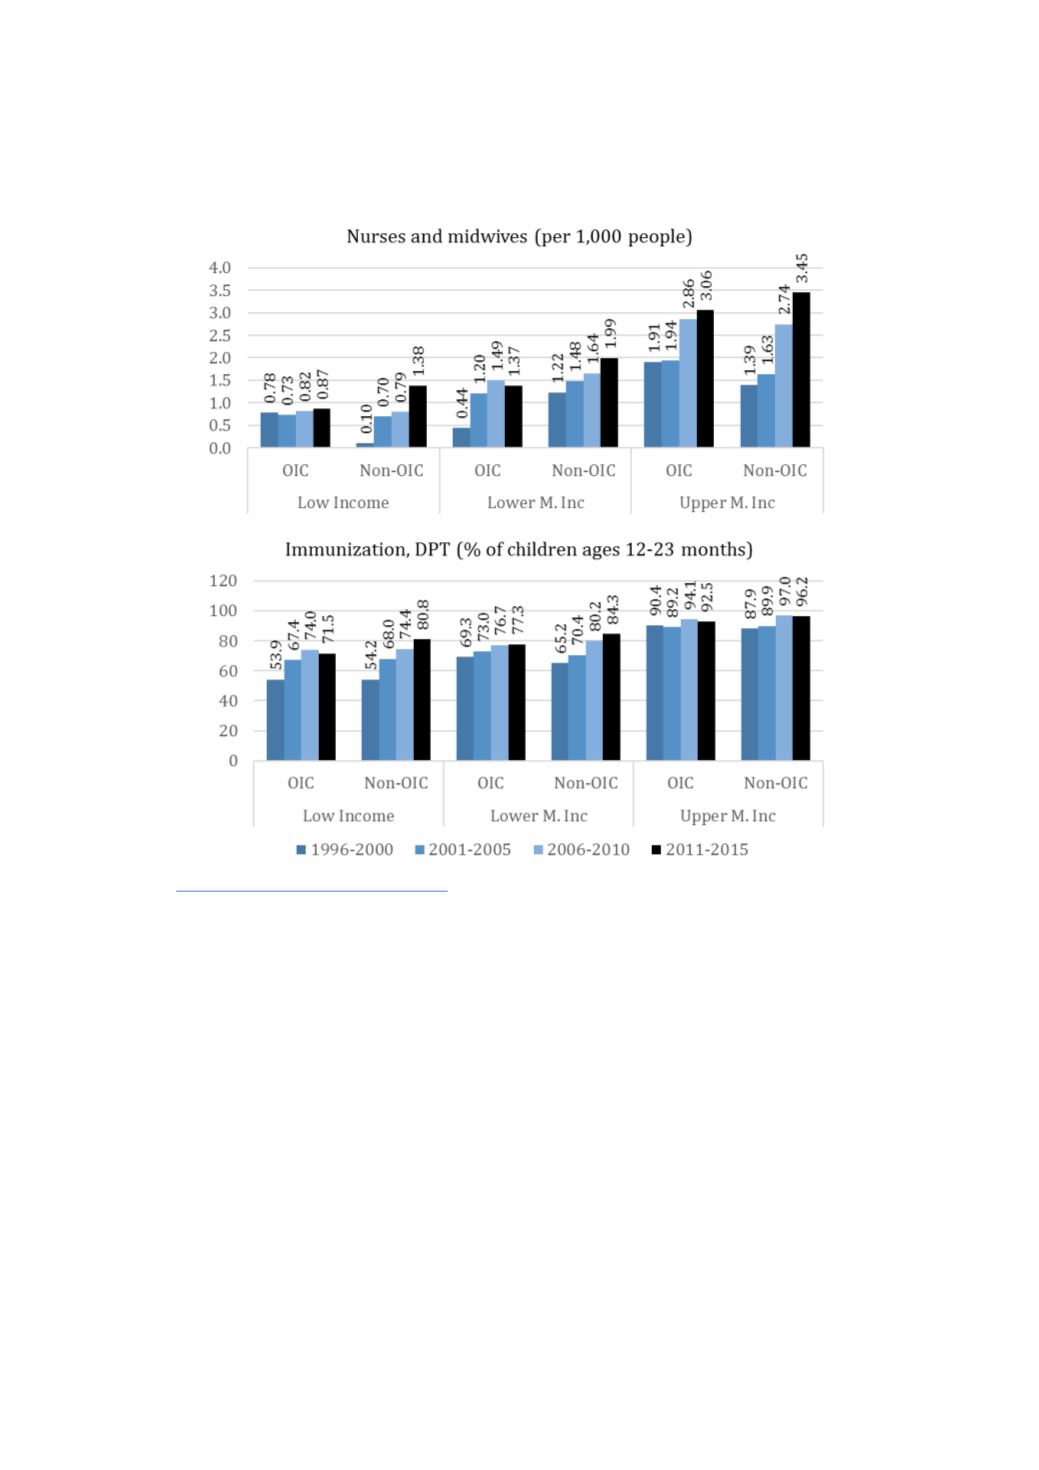
Figure 12: Trends of physical accessibility of health care (1996-2015)
Source
: https://data.worldbank.org/topic/healthFinancial Accessibility:
We use public spending on health (as a proportion of GDP) and out of pocket spending on health as
proxies on financial accessibility to health services
. Figure 13plots weighted averages of these two
indicators to examine status and historical trends in financial accessibility to health services.
Trends of public spending suggests that over the last 20 years only the upper-middle-income countries
had been able to set aside an incrementally increasing proportion on public health expenditure.
Financial investment in health as a proportion of expenditures has either stagnated or, in the case of
low-income OIC group, declined over the same period. The fact that low income OIC countries had
drastically cut (from 1.75 per cent in 1996-2000 to 1.05 per cent in 2011-2015) the relative public
spending on health underscores the challenges faced by the poor in these country in accessing health
services. Even if public health spending as a fraction of GDP is stable (similar to the case for lower-
middle-income countries i
n Figure 13), it still cannot prevent resource pressures in health provision
because demand for health in these countries is on a strong upward trend.
Insufficient public spending on health invariably leads to higher levels of out-of-pocket expenditure
on health, which is the second indicator examined i
n Figure 13.Irrespective of the income group, OIC
countries expend much higher levels out-of-pocket spending compared to non-OIC countries. The only