
24
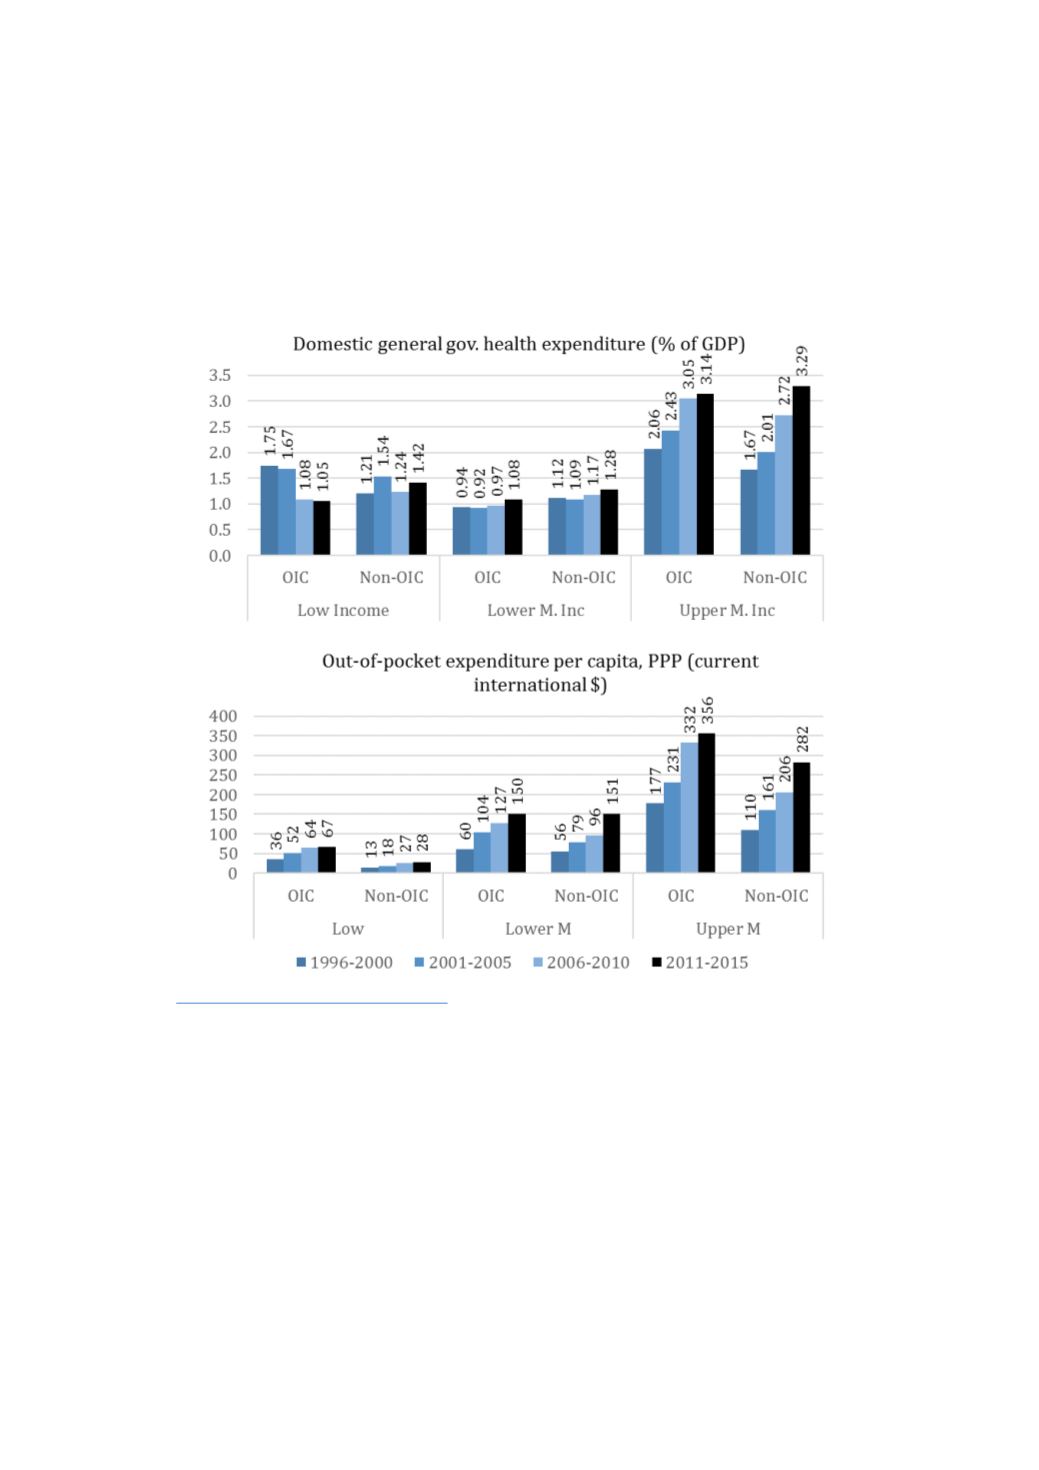
exception is the 2011-2015 period for lower-middle-income group for which both OIC and non-OIC
countries spend the same in out-of-pocket health spending. Higher level of out-of-pocket spending on
health can create financial hurdles against accessing health care, especially to the poor and the
vulnerable in these countries.
Figure 13: Trends of financial accessibility of health services (1996-2015).
Source
: https://data.worldbank.org/topic/healthService acceptability:
Acceptability of health services are discussed here using utilization of services as a proxy
. Figure 14presents information on trends in three indicators of service utilization. The first is the percentage of
births delivered in a health facility. The indicator refers to women who had a live birth recently (two
years for MICS and five years for DHS). The delivery data suggests that excepting in the low-income
category, in both the other income categories the non-OIC countries tend to do better in terms of
getting more babies delivered in health facilities. Here we interpret this evidence of poorer levels of
service acceptability among middle income OIC countries compared to non-OIC counterparts. This is
despite the OIC countries across all income groups having reported consistent improvements in
delivery statistics over the 20-year period.
The second graph in
Figure 14 summarizes the proportion of births attended by skilled health
personnel. The numerator here is number of women age 15-49 years with a live birth in the last 2


