


 21 / 108

14
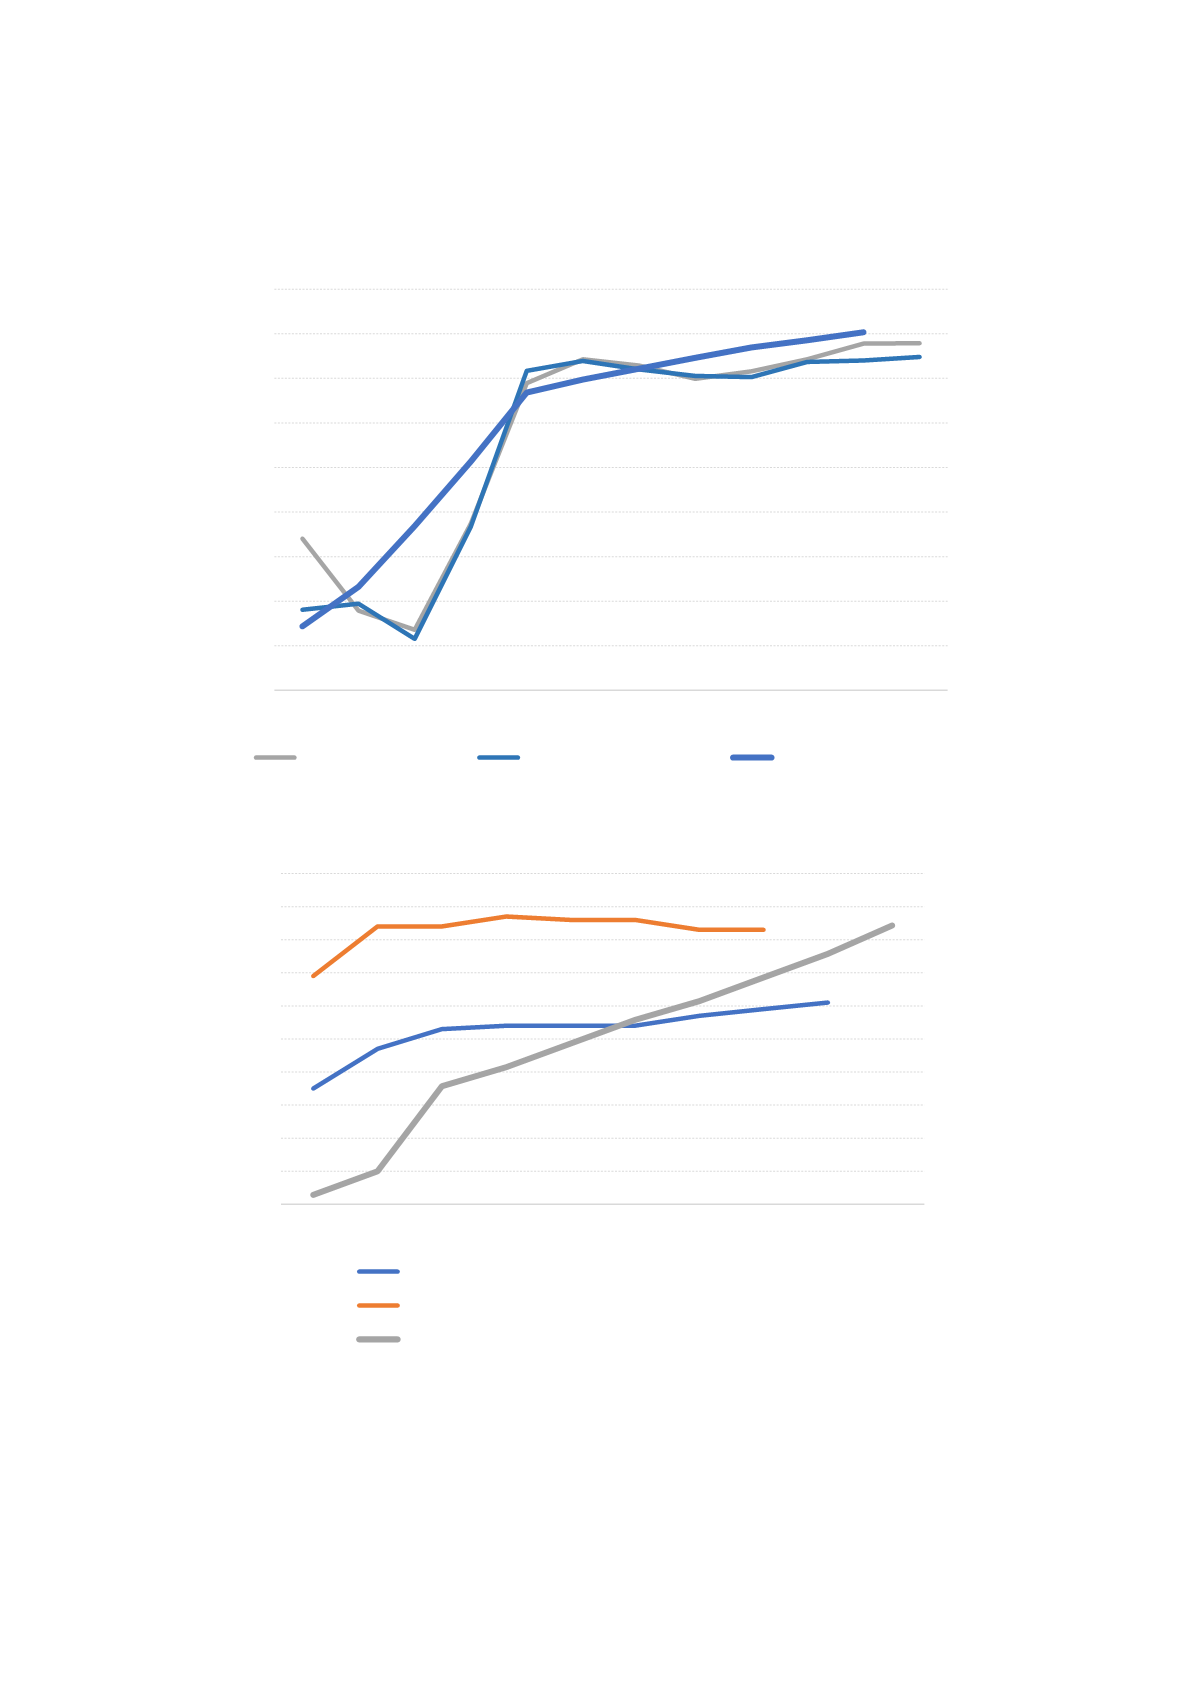
Figure 6: Global immunization rates for DPT and measles, and global life expectancy between 1990
and 2017
Figure 7: Tuberculosis detection and treatment success, and share of people living with HIV in ART
Source: World Development Indicators
(Figure 5 - Figure 7)76,8
85,6
73,6
85,0
65,4
72,0
64,0
65,0
66,0
67,0
68,0
69,0
70,0
71,0
72,0
73,0
70,0
72,0
74,0
76,0
78,0
80,0
82,0
84,0
86,0
88,0
1990 1995 2000 2005 2010 2011 2012 2013 2014 2015 2016 2017
Life expectancy at birth in years
Immunization coverages in percent of
children aged 12-23 months
Immunization, DPT
Immunization, measles
Life expectancy at birth
35,0
61,0
69,0
83,0
2,0
59,0
0,0
10,0
20,0
30,0
40,0
50,0
60,0
70,0
0,0
10,0
20,0
30,0
40,0
50,0
60,0
70,0
80,0
90,0
100,0
2000 2005 2010 2011 2012 2013 2014 2015 2016 2017
Antiretrovial therapy coverage (% of peole
living with HIV)
Tuberculosis detection (% of all forms) and
treatment success rates (% of new cases)
Tuberculosis case detection rate (%, all forms) .. ..
Tuberculosis treatment success rate (% of new cases) .. ..
Antiretroviral therapy coverage (% of people living with HIV)