


 20 / 108

13
comprehensive plan, and c) the effective use of evidence (data), can be crucial to achieve a more
equitable world. Because of such international response, the official development assistance increased
by 66 per cent between 2000 and 2014 (UN, 2015). The international effort continued afterwards with
the endorsement of 17 Sustainable Development Goals (SDGs) for continued global development to
end poverty, promote well-being and protect the planet by 193 countries in 2015. SDG 3 focuses
exclusively on “ensuring healthy lives and promoting well-being for all at all ages.” Another 10 goals
and altogether more than 50 indicators relate to health - signposting health equity as a global priority.
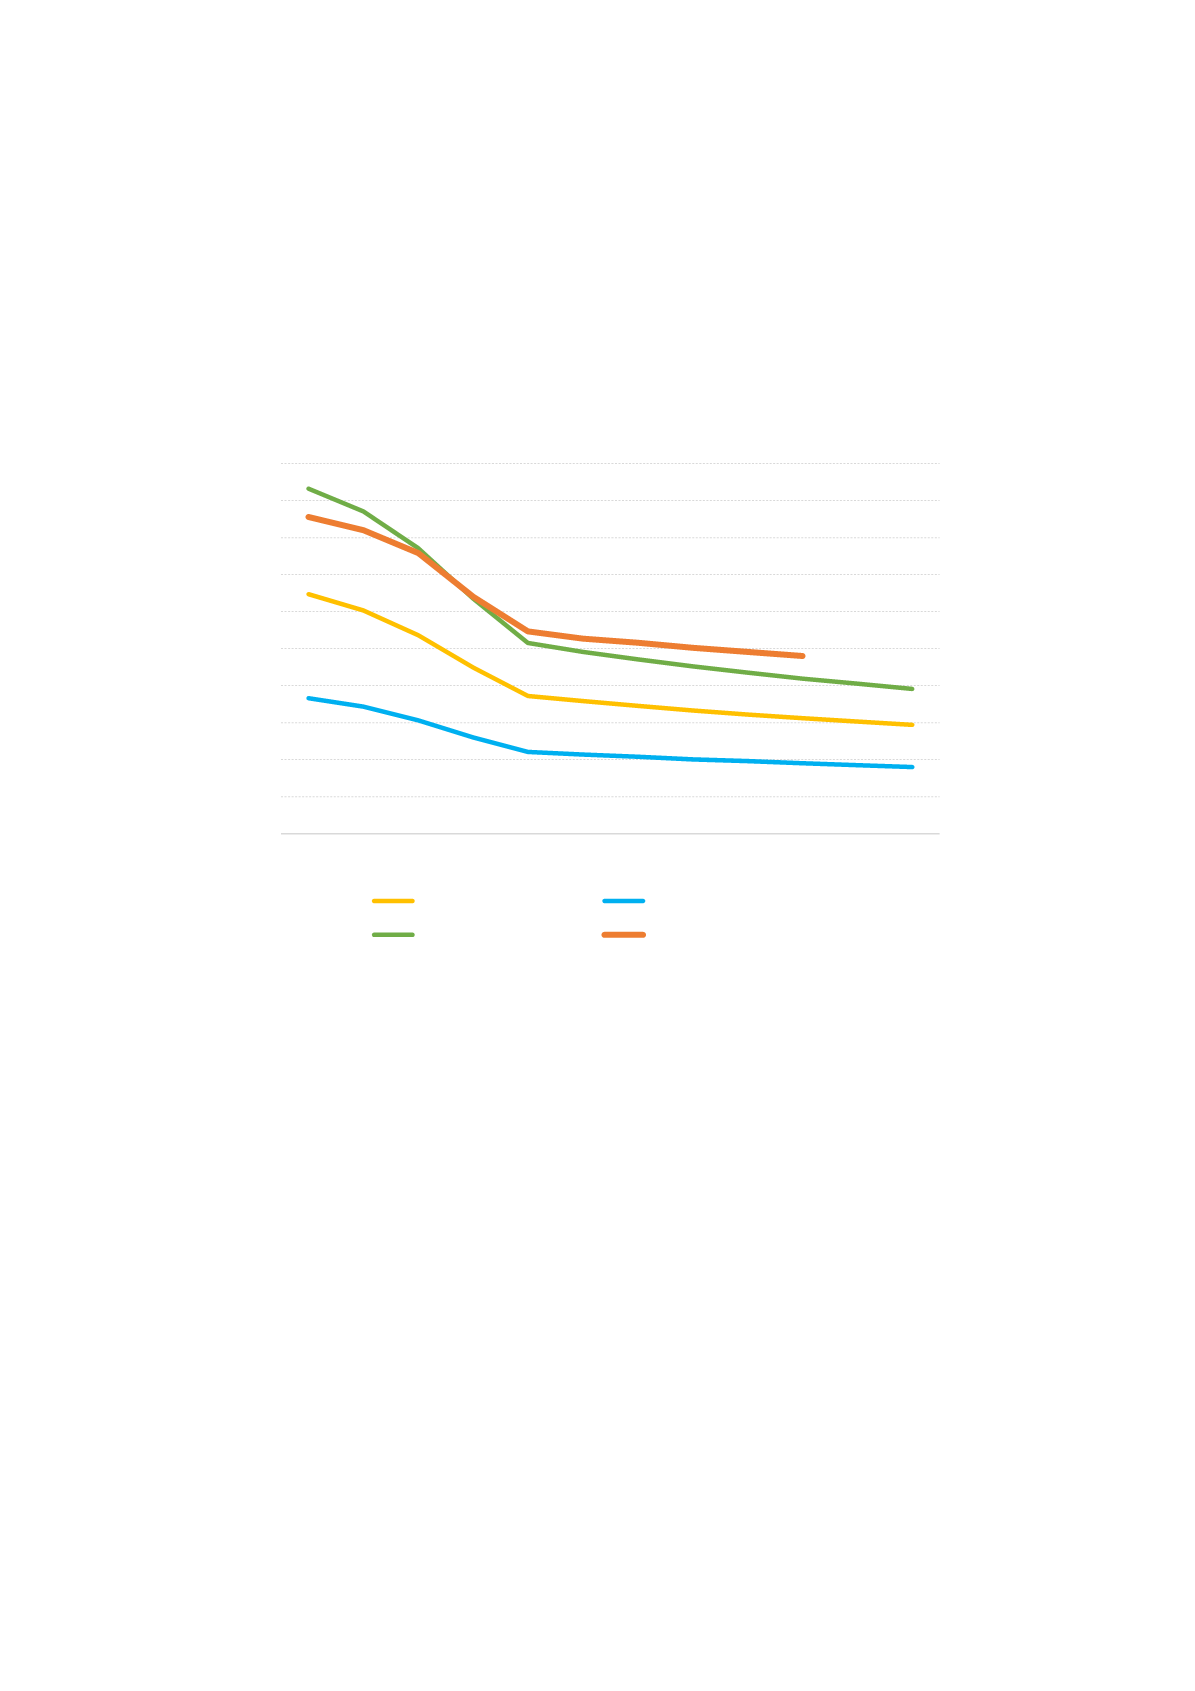
Figure 5: Global mortality rates between 1990 and 2017
64,7
29,4
36,6
18,0
93,2
39,1
385,0
216,0
0,0
50,0
100,0
150,0
200,0
250,0
300,0
350,0
400,0
450,0
0,0
10,0
20,0
30,0
40,0
50,0
60,0
70,0
80,0
90,0
100,0
1990 1995 2000 2005 2010 2011 2012 2013 2014 2015 2016 2017
Maternal mortality rate per 100,000 live births
Neonatal, infant and under-5 mortality rates
per 1,000 live births
Infant mortality rate
Neonatal mortality rate
Under-5 mortality rate
Maternal mortality ratio