


 26 / 108

19
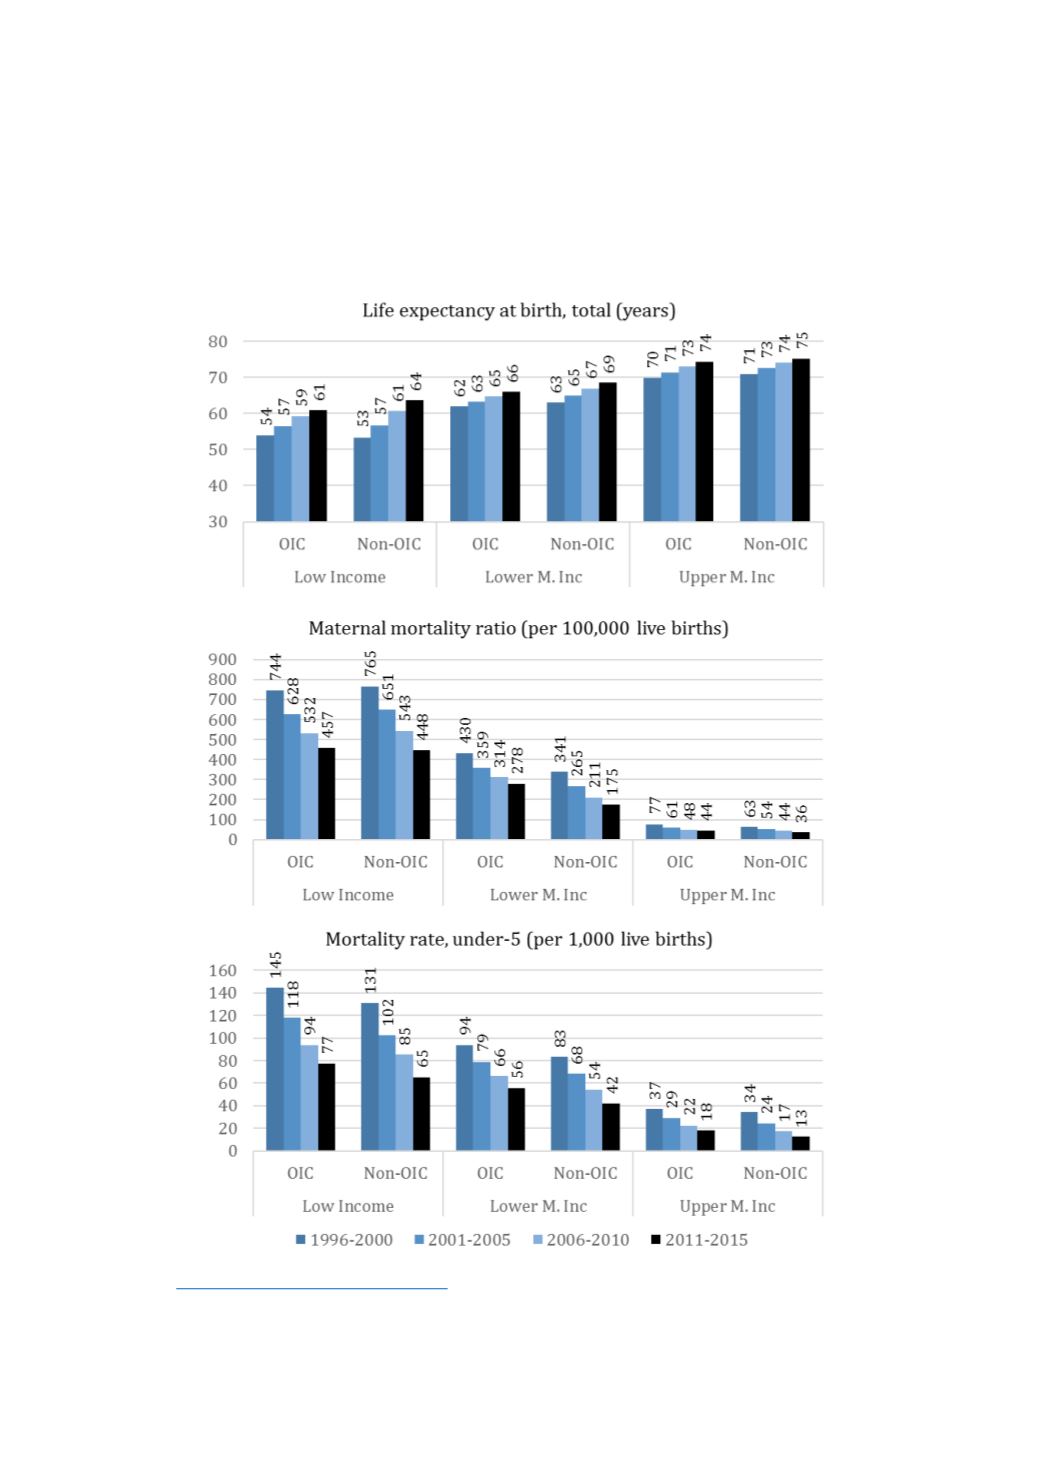
calculated. As explained before the averages were for 5-year periods. The height of each vertical bar
represents one of these weighted averages.
Figure 11: Trends in demand for health services and health outcomes: OIC vs. non-OIC comparison
over the period 1996 to 2015
Source
: https://data.worldbank.org/topic/health