
45
known. Nevertheless, analysis of available data for the sub-group of countries that participate
in international assessments highlights two important patterns. Based on PISA 2012 data,
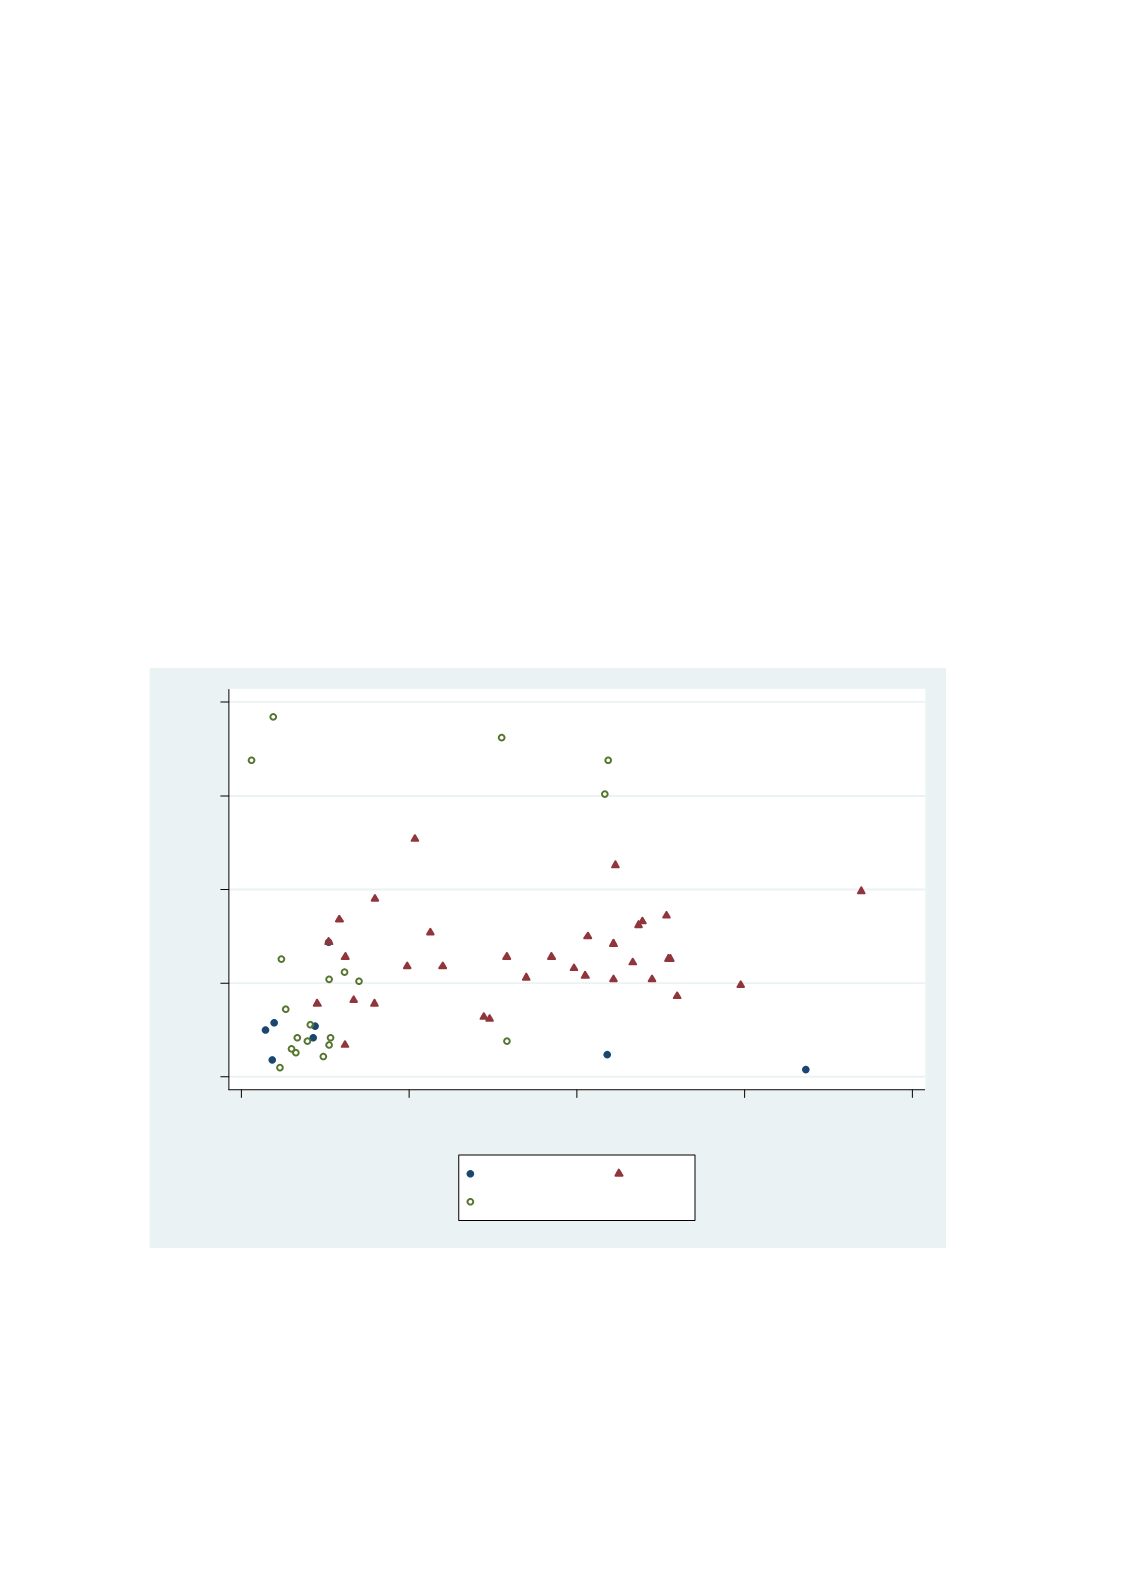
Figure 2.27
reports share of resilient students. Resilient students are disadvantaged students,
who belong to the lowest 25% of socioeconomic status but are among top 25% students
internationally in terms of performance. First, even among countries such as Indonesia, Jordan,
Tunisia and Malaysia where inequality in access to school (in terms of years of schooling
completed) is low, the share of resilient students is very low. This implies that children from the
poorest socio-economic groups in these countries have a very small presence in the topic
quartile performing student population in PISA assessment. The only OIC country where the
share of resilient student population is above 5% is Turkey. This is significant because in PISA
2012, 6% of students across OECD countries (approximately one million students) are
“resilient” -- they defy the socio-economic odds against them and score among the top 25% of
students internationally, when compared with students in other countries. In East Asian
countries like Hong Kong-China, Macao-China, Shanghai-China, Singapore and Viet Nam,
13% of students or more are resilient and perform among the top 25% of students across all
participating countries and economies.
Figure 2.27: Share of Resilient Students in PISA 2012
Source: Author’s calculation using data from OECD (2012)
Another way to formalize the study of learning outcomes and inequality of access to quality
education is by measuring the extent of inequality of learning opportunity in the education
system. Learning opportunity can be defined as obtaining the minimum level of academic
performance necessary to participate effectively and productively in adult life. Such analysis
ARE
IDN
JOR
KAZ
MYS
QAT
TUN
TUR
0
5
10
15
20
0
20000
40000
60000
80000
GDP per capita, 2006-2010
OIC
OECD
NON-OECD


