
41
fact that the proportion of children from the poorest wealth group from rural OECD countries
achieving basic competency in science is much higher when compared to the proportion of
children from the wealthiest urban population in OIC countries.
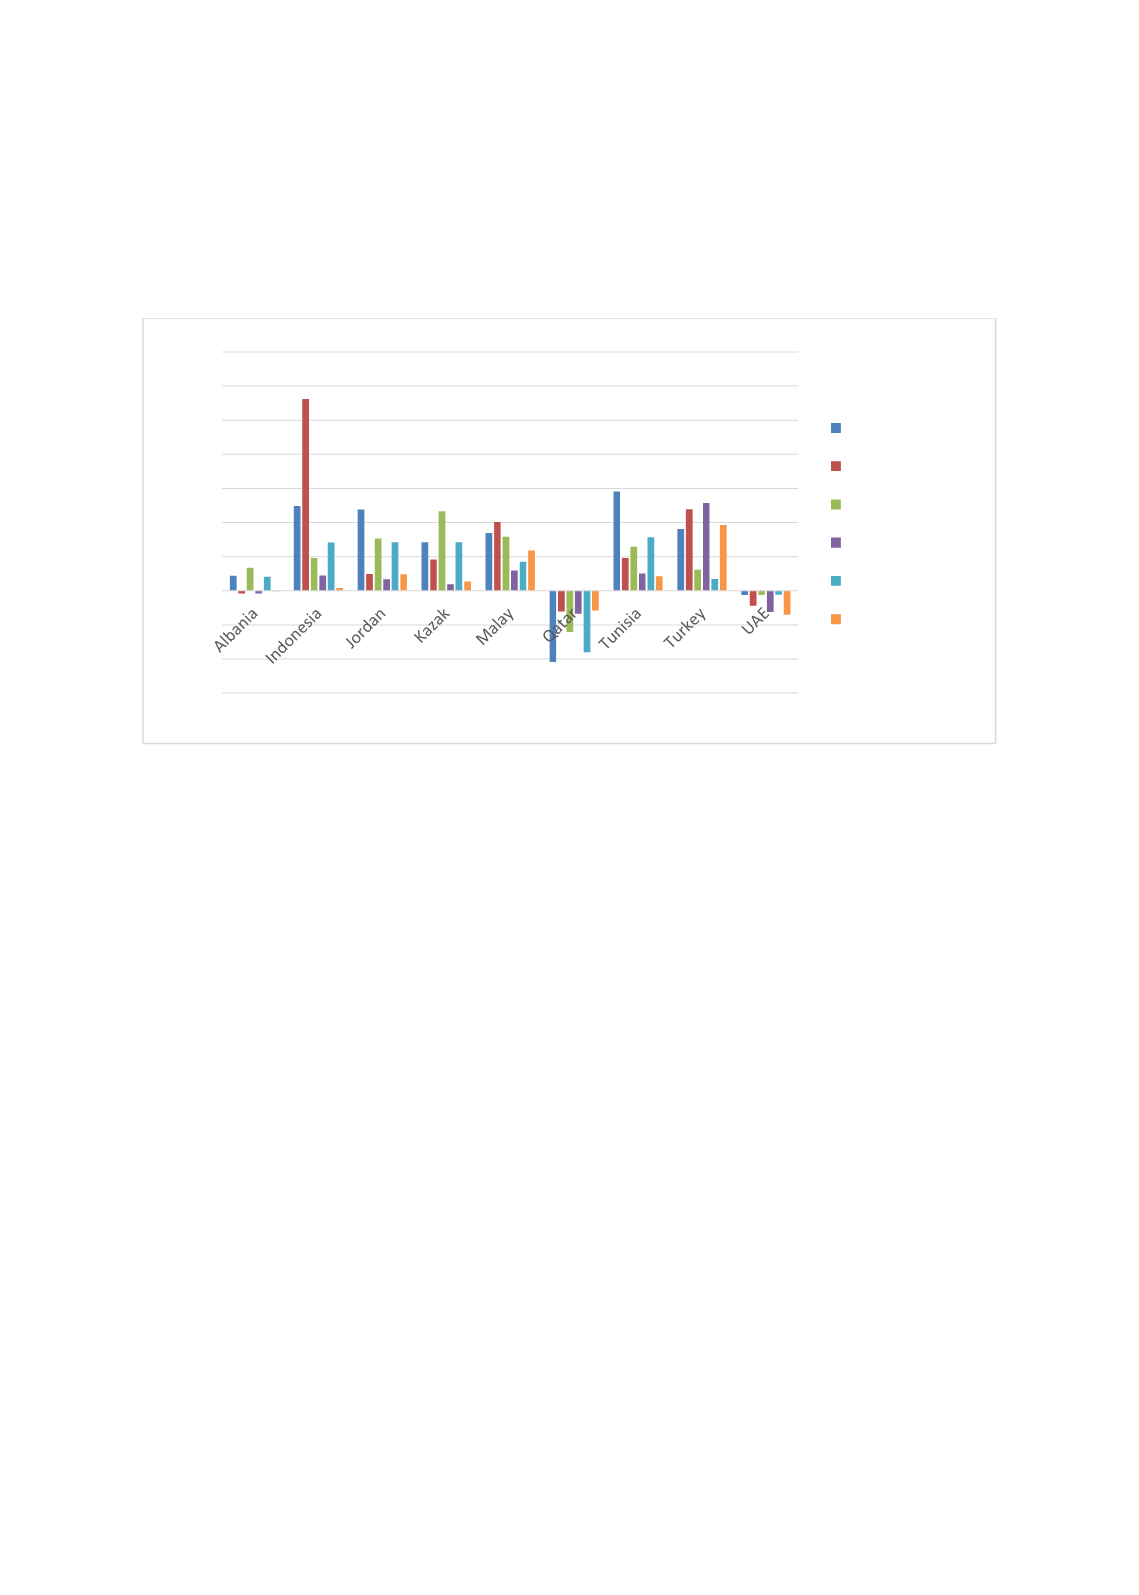
Figure 2.23: Top-Bottom Wealth Quintile Learning Gaps in OIC Countries, PISA 2012
Source: Author’s calculation based on WIDE data.
The top-bottom wealth gaps in OIC countries described in Figures 2.21 and 2.22 are striking.
Therefore, it is useful to unpack the country specific patterns. For illustrative purposes,
Figure
2.23
reports estimates of bottom-top quintile absolute gaps for OIC countries that participated
in PISA 2012. In all countries, the gap narrows in higher level of competency level 4). One
exception is mathematics achievement in Indonesia where the top-bottom gap is the largest
among all participating OIC countries and that too in case of level 4. Two countries where there
is a reversal of the wealth advantage are Qatar and UAE. Achievement gap is widens
monotonically across wealth groups to the disadvantage of children from wealthier quintile, a
result which merits further investigation.
-0,30
-0,20
-0,10
0,00
0,10
0,20
0,30
0,40
0,50
0,60
0,70
math, level1
math, level4
reading, level1
reading, level4
science, level1
science, level4


