
43
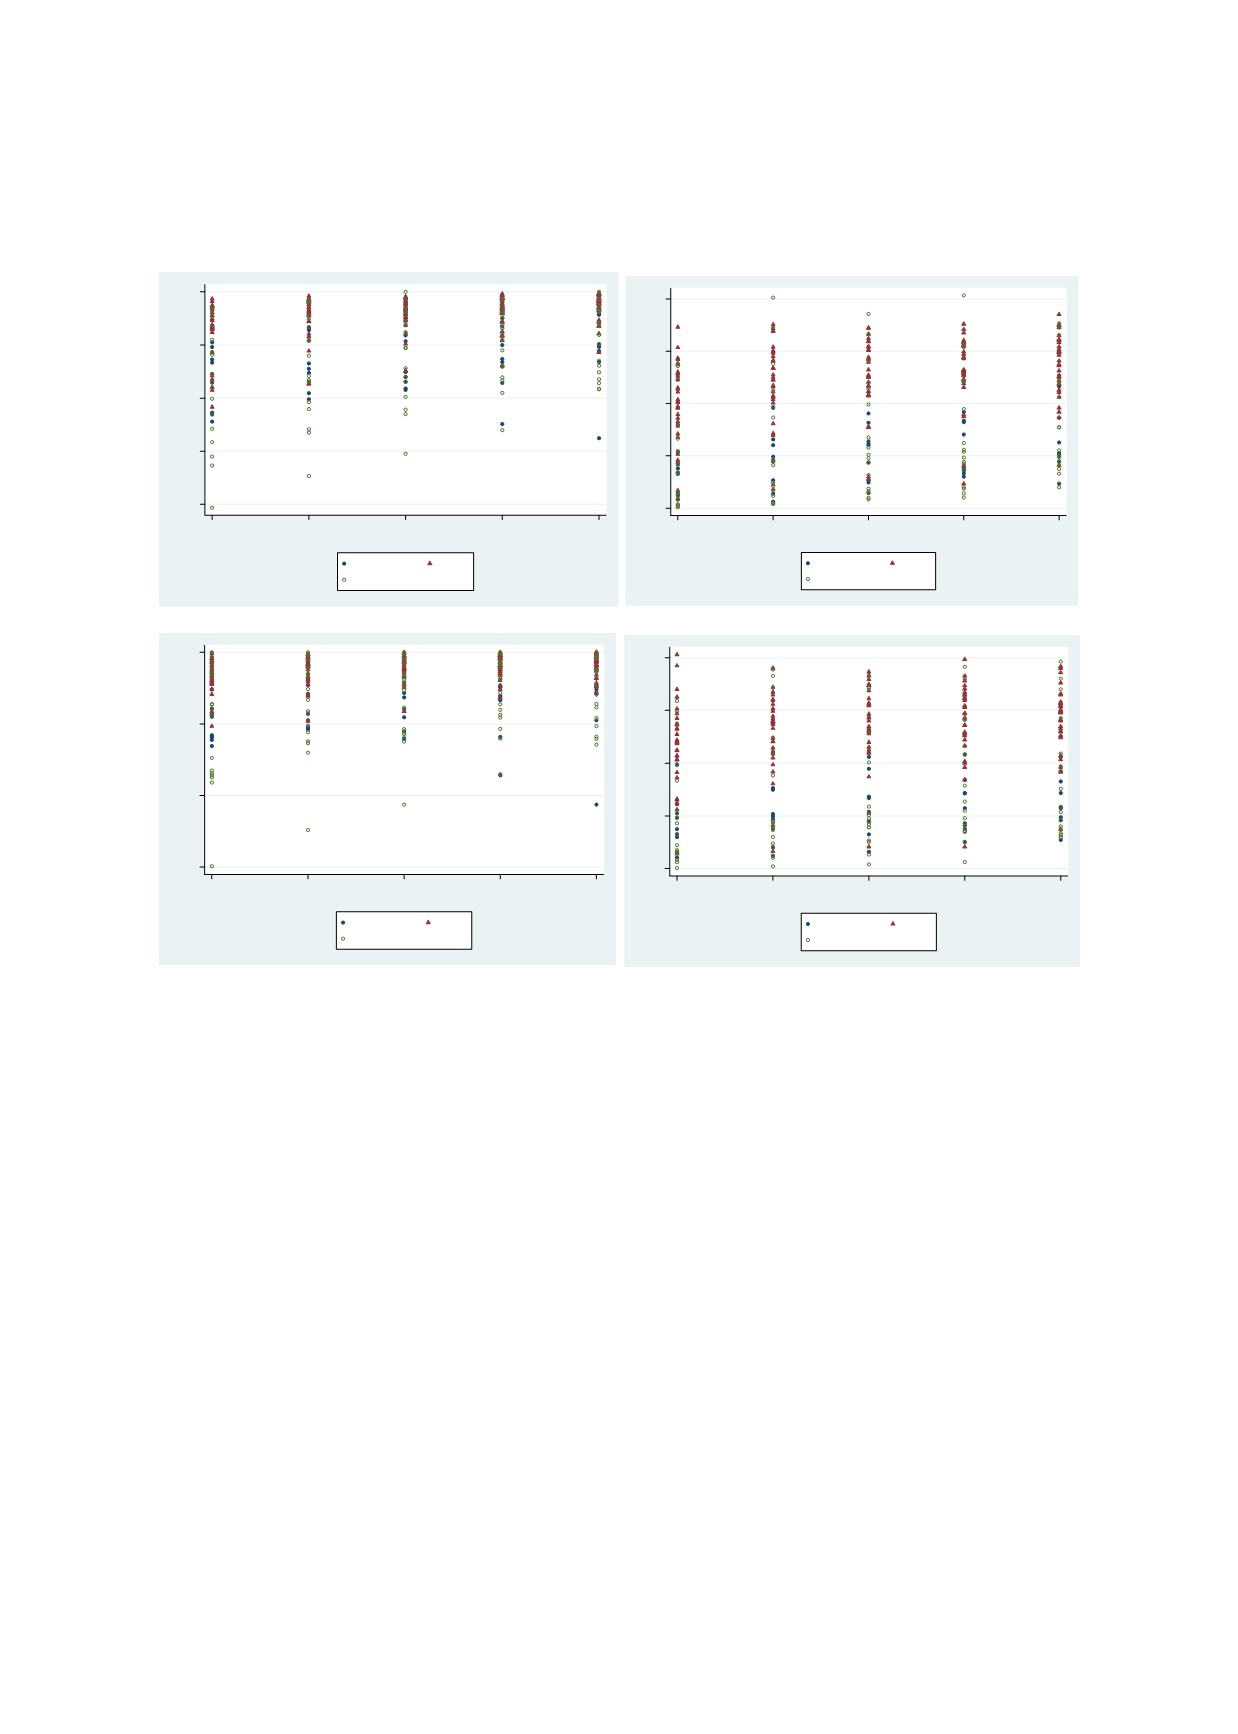
Figure 2.25: Wealth Gradient of Learning Levels in Urban OIC vs Rural OECD and Non-OECD,
PISA 2012
Source: Author’s calculation. Wealth quintiles are country specific.
Figure 2.25
repeats the above analysis using PISA 2012 data. For illustrative purposes, only
levels 1 and 3 proficiency are considered. Compared to TIMSS (Figure 2.24), there is less
performance disparity within OIC across countries in PISA data. A much larger proportion of
children from the poorest wealth quintile succeed in crossing the minimum learning threshold
(level 1) in math and science. While the share of children attaining minimum learning increases
monotonically across wealth quintiles, the rich-poor gap is moderate compared to that in TIMSS
data. One country that is an exception to this monotonic positive relationship is Qatar, where
performance systematically declines in higher quintiles suggesting a ‘resource curse’. This is
true regardless of the assessment subject (math and science) and the level of proficiency.
Another country with weak wealth effect is Albania where the proportion of children crossing
levels 1 and 3 proficiency is low across all wealth groups. In terms of the performance of children
from the wealthiest group, Albania is ranked eight out of the nine participating OIC countries.
On the other hand, Kazakhstan does exceptionally well in minimizing the wealth gap. More than
80% Kazakhstani children in the bottom wealth group succeed in crossing the basic proficiency
threshold in math and science. Also impressive is the performance of Turkey -- in basic science
proficiency (i.e. level 1), Turkish children of all wealth groups show above 90% attainment.
The wealth effect documented above is worrying. Improved access to education is widely
regarded as a force for equalization of economic outcomes. However, this positive role of
ALB
ALB
ALB
ALB
ALB
IDN
IDN
IDN
IDN
IDN
JOR
JOR
JOR
JOR
JOR
KAZ
KAZ
KAZ
KAZ
KAZ
MYS
MYS
MYS
MYS
MYS
QAT
QAT
QAT
QAT
QAT
TUN
TUN
TUN
TUN
TUN
TUR
TUR
TUR
TUR
TUR
ARE
ARE
ARE
ARE
ARE
.2
.4
.6
.8
1
1
2
3
4
5
wealth quintiles
OIC
OECD
NON-OECD
ALB
ALB
ALB
ALB
ALB
IDN
IDN
IDN
IDN
IDN
JOR
JOR
JOR
JOR
JOR
KAZ
KAZ
KAZ
KAZ
KAZ
MYS
MYS
MYS
MYS
MYS
QAT
QAT
Q T
QAT
QAT
TUN
TUN
TUN
TUN
TUN
TUR
TUR
TUR
TUR
TUR
ARE
ARE
ARE
ARE
ARE
0
.2
.4
.6
.8
% of children passing level-3 maths threshold
1
2
3
4
5
wealth quintiles
OIC
OECD
NON-OECD
ALB
ALB
ALB
ALB
ALB
IDN
IDN
IDN
IDN
IDN
JOR
JOR
JOR
JOR
JOR
KAZ
KAZ
KAZ
KAZ
KAZ
MYS
MYS
MYS
MYS
MYS
QAT
QAT
QAT
QAT
QAT
TUN
TUN
TUN
TUN
TUN
TUR
TUR
TUR
TUR
TUR
ARE
ARE
ARE
ARE
ARE
.4
.6
.8
1
1
2
3
4
5
wealth quintiles
OIC
OECD
NON-OECD
ALB
ALB
ALB
ALB
ALB
IDN
IDN
IDN
IDN
IDN
JOR
JOR
JOR
JOR
JOR
KAZ
KAZ
KAZ
KAZ
KAZ
MYS
MYS
MYS
MYS
MYS
QAT
QAT
QAT
QAT
QAT
TUN
TUN
TUN
TUN
TUN
TUR
TUR
TUR
TUR
TUR
ARE
ARE
ARE
ARE
ARE
0
.2
.4
.6
.8
% of children passing level-3 science threshold
1
2
3
4
5
wealth quintiles
OIC
OECD
NON-OECD


