
40
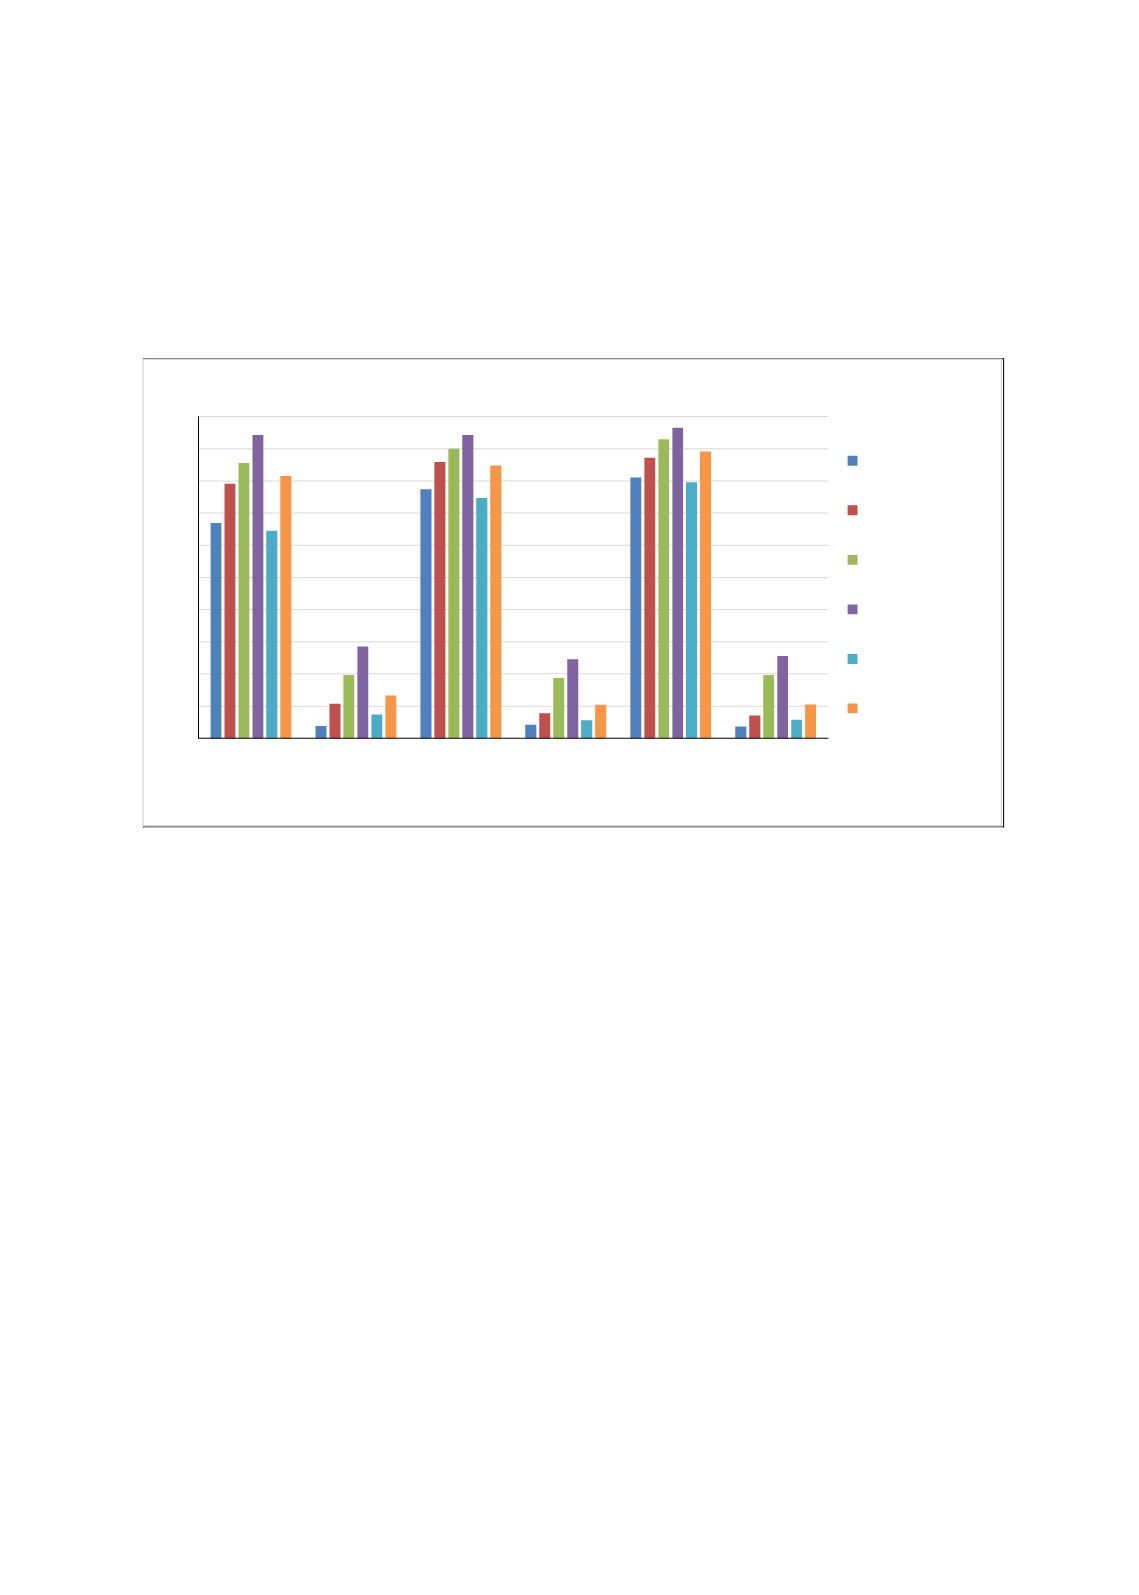
quality and highly unequal education system. Third, the poor quality is reflected in the fact that
the proportion of children from the poorest wealth group from rural OECD countries achieving
basic competency in science is almost identical to that corresponding to children from the
wealthiest urban population in OIC countries.
Figure 2.22: Learning Levels of Children from Top and BottomWealth Groups in Urban OIC
vs. Rural OECD and Non-OECD, PISA 2012
Source: Author’s calculation based on WIDE database
One can also compare the performance of children from urban OIC sample with those from rural
children in non-OIC countries based on PISA 2012 data. The mean proportions of urban students
attaining levels 1 and 4 math competency in the OIC sample are 0.74 and 0.07. These are much
lower compared to rural students in OECD (0.90 and 0.25 respectively) and non-OECD (0.75 and
0.11 respectively). Similar gaps are noticeable in case of reading -- 0.83 and 0.06 urban students
achieve levels 1 and 4 competence in reading (0.85 and 0.05 in science). However, the
corresponding figures for rural students from OECD countries are much higher -- 0.93 and 0.22
in reading (0.95 and 0.23 in science respectively). This is also true when compared to rural
students from non-OECD countries (0.81 and 0.08 in reading and 0.85 and 0.09 in science
respectively).
Therefore
Figure 2.22
plots PISA 2012 performance data for urban OIC against rural children
from OECD and non-OECD countries, restricting analysis to the top and bottom wealth groups.
A number of patterns are noteworthy. First, compared to TIMSS, the top-bottom wealth group
gap is smaller among urban children in OIC countries in basic mathematics competency (level 1
achievement); approximately 10 percentage point more children from the wealthiest group
cross the level-1 achievement threshold. But wealth gap is in general also smaller in PISA data
for other non-OIC countries.
Second, top-bottom wealth gap is largest in math, compared to science and reading, in non-OIC
countries. Third, the poor quality of education in participating OIC countries is reflected in the
0
0,1
0,2
0,3
0,4
0,5
0,6
0,7
0,8
0,9
1
math, level1 math, level4 reading,
level1
reading,
level4
science,
level1
science,
level4
OIC, urban q1
OIC, urban q5
OECD, rural q1
OECD, rural q5
NOECD, rural q1
NOECD, rural q5


