
44
education can be undermined if (a) access and participation does not imply learning and (b)
opportunities to learn depend on one’s socio-economic circumstances.
Gini coefficient of educational attainment (i.e. years of school completed) has declined from 0.68
in 1970 to 0.30 in 2010. In all Arab countries, inequality in access to education has declined
during 1970-2010. These include United Arab Emirates, Saudi Arabia, Jordan, Turkey and
Bahrain. However, progress has been slow in countries such as Iraq and Morocco (Ibourk and
Amaghouss 2012). The majority countries around the world including the OIC member states
have seen a steady decline in inequality in years of schooling completed over time. Nonetheless,
by the year 2010, the educational gini coefficient is high in a number of countries comparable to
OECD countries.
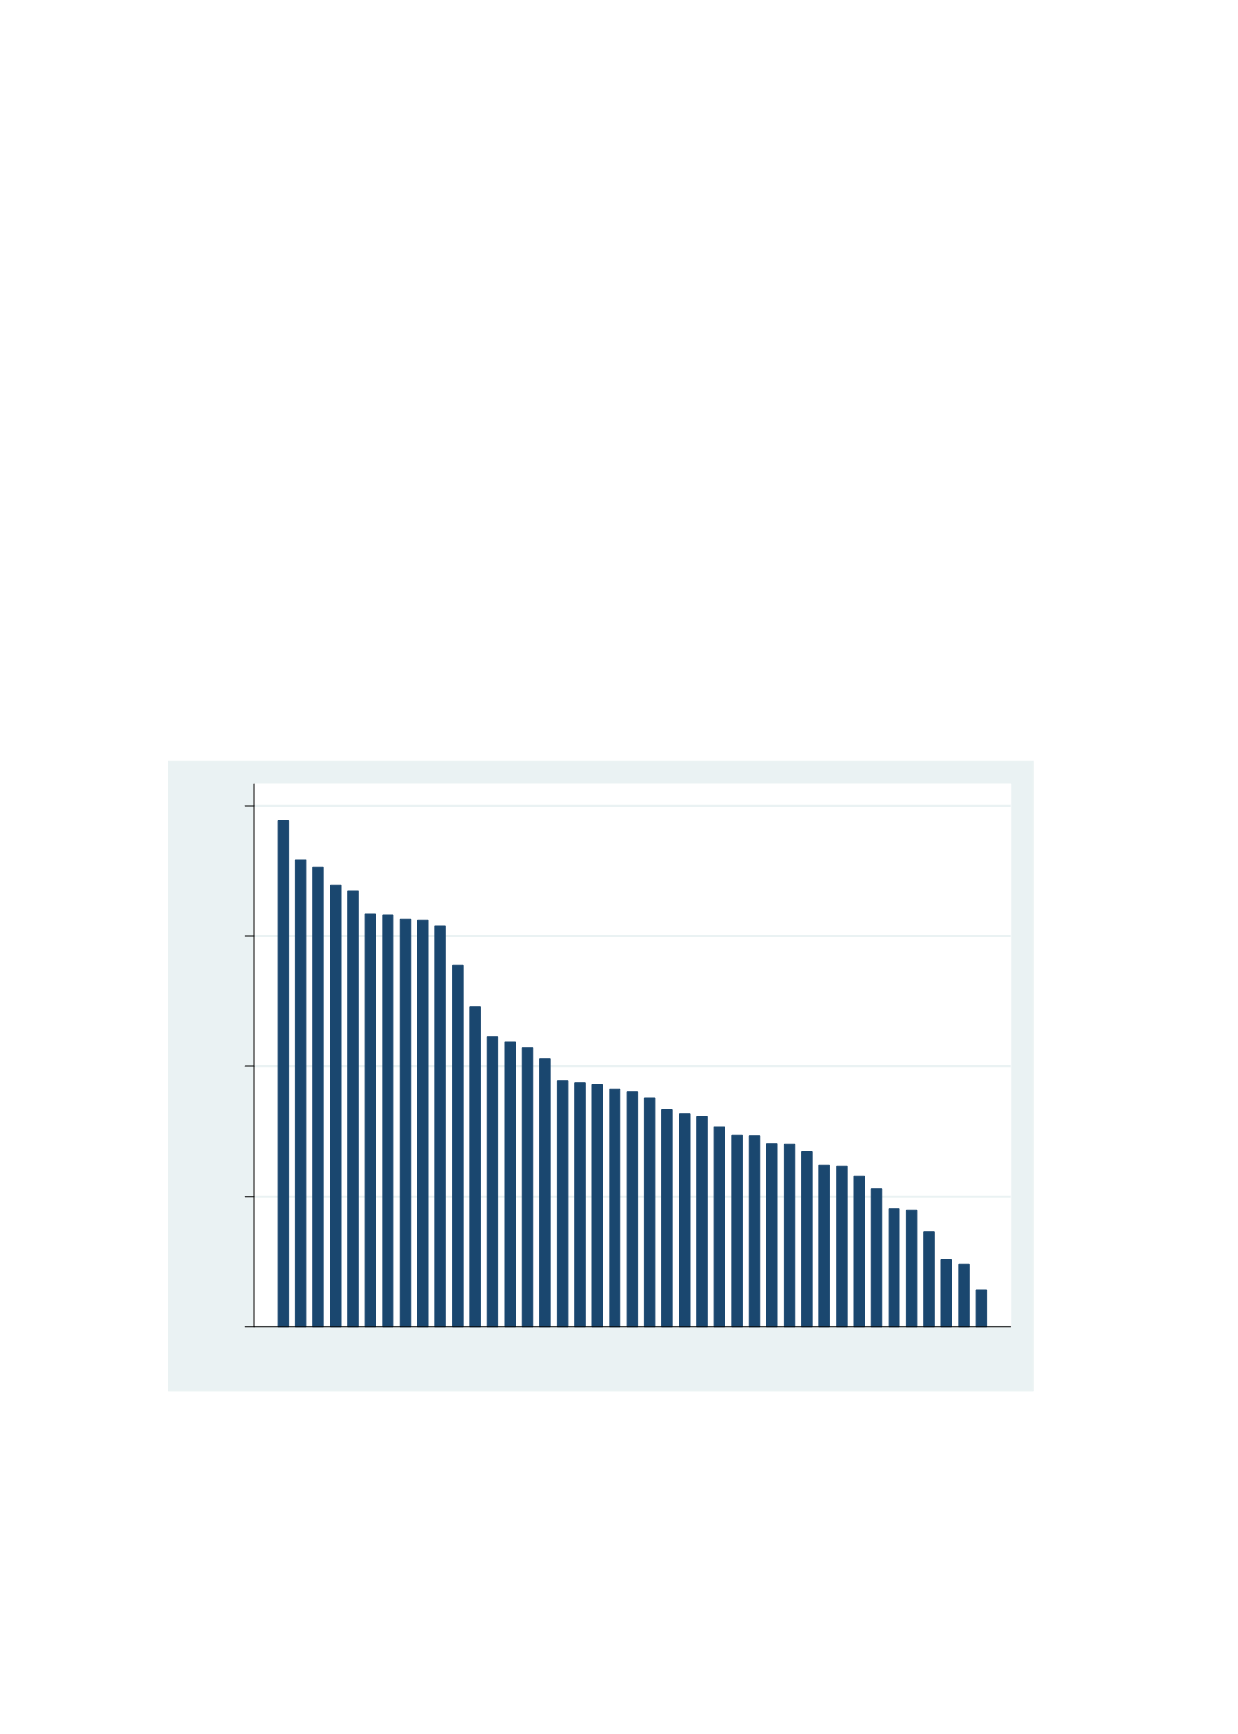
Figure 2.26
presents the scatter plot of data on educational gini coefficient
against GDP per capita. Most OECD countries reported a gini coefficient below 0.20 in 2010.
Member countries that belonged to this category are Albania, Tajikistan, Kazakhstan, Kirgizstan,
Malaysia and Bahrain. At the same time, 8 member countries (such as Nigeria and Mozambique)
have a very high level of inequality in access to education (gini coefficient above 0.60) while
Pakistan and Bangladesh and four others have moderately high level of inequality (gini
coefficient between 0.40 and 0.60). Egypt, Indonesia, Jordan, Saudi Arabia belong to countries
with a relatively low level of inequality (gini coefficient between 0.20 and 0.40).
Figure 2.26: Inequality in School Completion (Educational Gini Coefficient) in OIC Countries
Source: Author’s calculation using data from Ibourk & Amaghouss (2012)
In OIC countries with low inequality of access to education, a major challenge is the inequality
of learning opportunities. Since comparable learning data is available for only a handful of
member states, the extent of inequality in student achievement across member states is not
0
.2
.4
.6
.8
NER
MOZ
MLI
SLE
GMB
BEN
YEM
CIV
AFG
SDN
MAR
PAK
TGO
IRQ
BGD
MRT
QAT
EGY
SEN
LBY
TUN
CMR
IRN
MDV
IDN
DZA
BRN
KWT
GAB
TUR
JOR
UGA
SAU
ARE
GUY
MYS
KGZ
BHR
TJK
KAZ
ALB


