
50
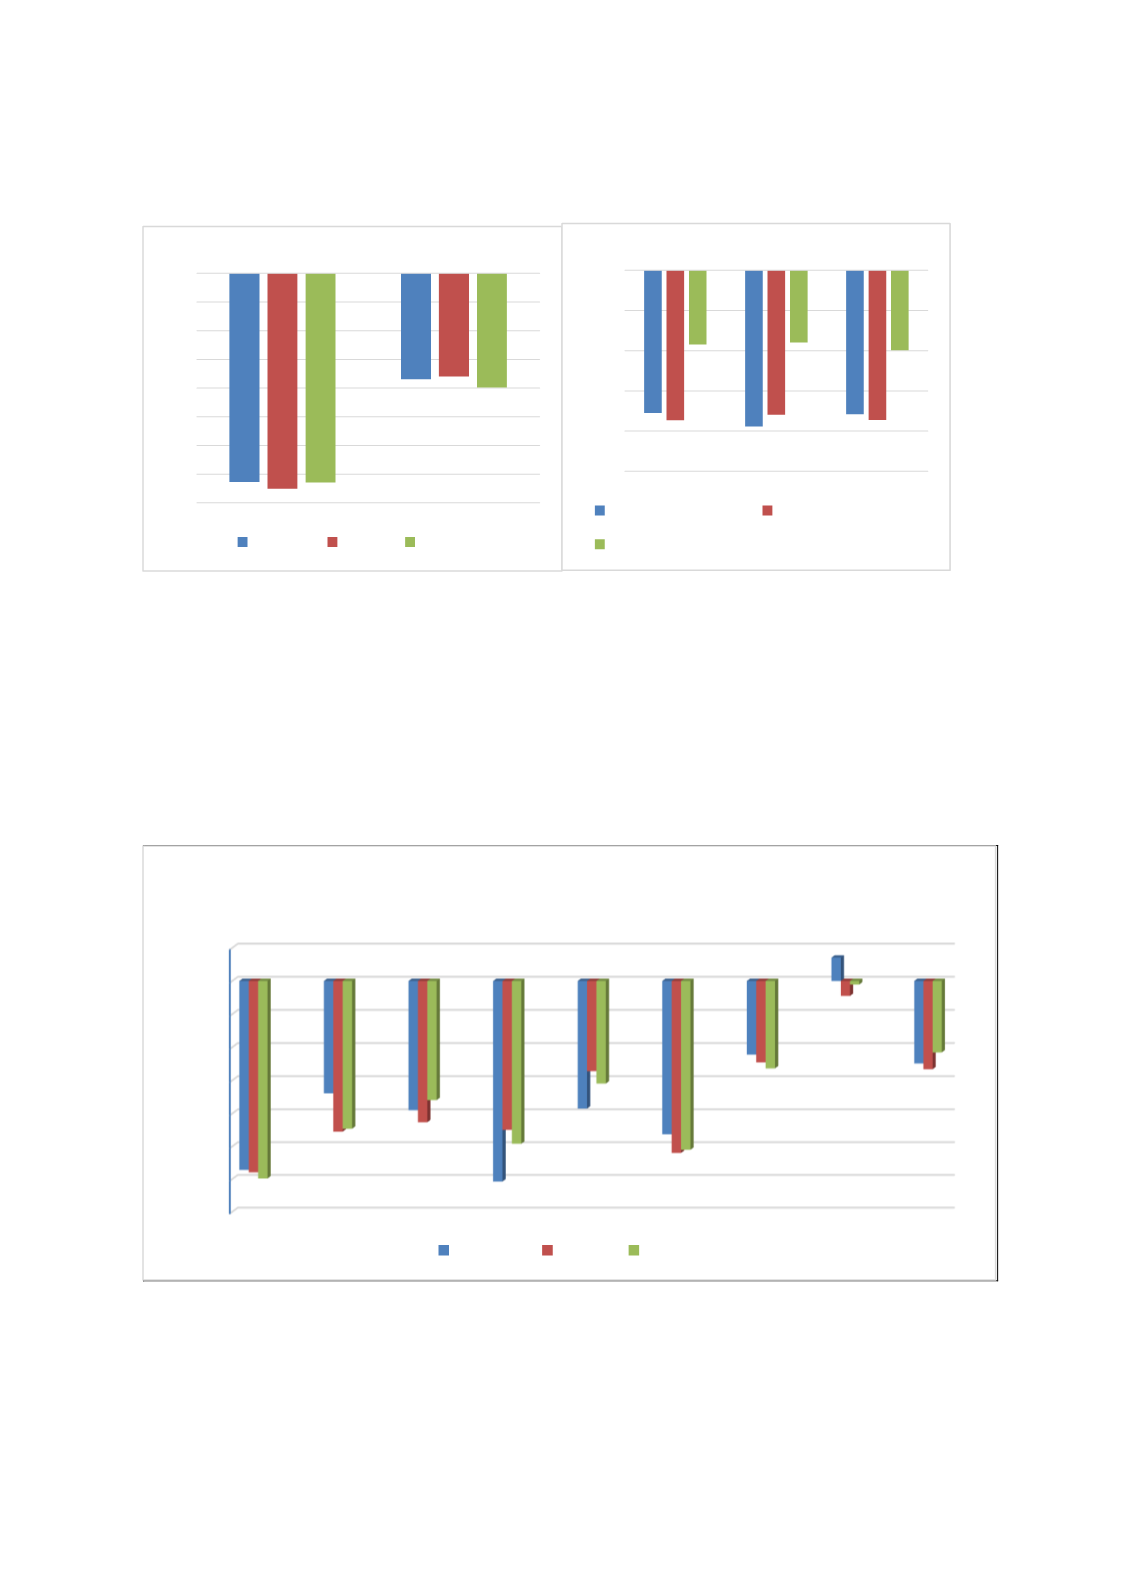
Figure 2.28: Learning Shortfalls in OIC and Non-OECD vs. OECD Countries, PISA 2012
Source: Author’s calculation based on PISA 2012 data. Note: Estimates based on OLS model of student
achievement with students from OECD countries as the comparator group. All underlying regressions include
control for covariates included in
Table 2.1
.
Figure 2.29
repeats the exercise by replacing OIC group indicator variable with country specific
indicators. Only Turkey appears to have no systematic shortfall in learning vis-à-vis other OECD
countries once differences in socio-economic conditions and school resources are taken into
account. The gap in case of Tunisia and UAE is also modest (around 40-50 points). The laggards
among participating countries are Albania, Kazakhstan, and Qatar where the average gap is
around 100 points.
Figure 2.29: Learning Shortfalls in OIC vs. OECD Countries, PISA 2012
Source:
Author’s calculation based on PISA 2012 data.
Note:
Estimates based on OLS model of student
achievement with students from the OECD countries as the comparator group. All regressions include control
for covariates included in
Table 2.1
.
-80
-70
-60
-50
-40
-30
-20
-10
0
OIC
Non-OECD
Reading Maths Science
-100
-80
-60
-40
-20
0
Reading
Maths
Science
OIC_arab
OIC_asia (non-Arab)
Non-OECD
-140
-120
-100
-80
-60
-40
-20
0
20
Albania
Indonesia
Jordan
Kazak
Malaysia
Qatar
Tunisia
Turkey
UAE
Reading Maths Science


