
42
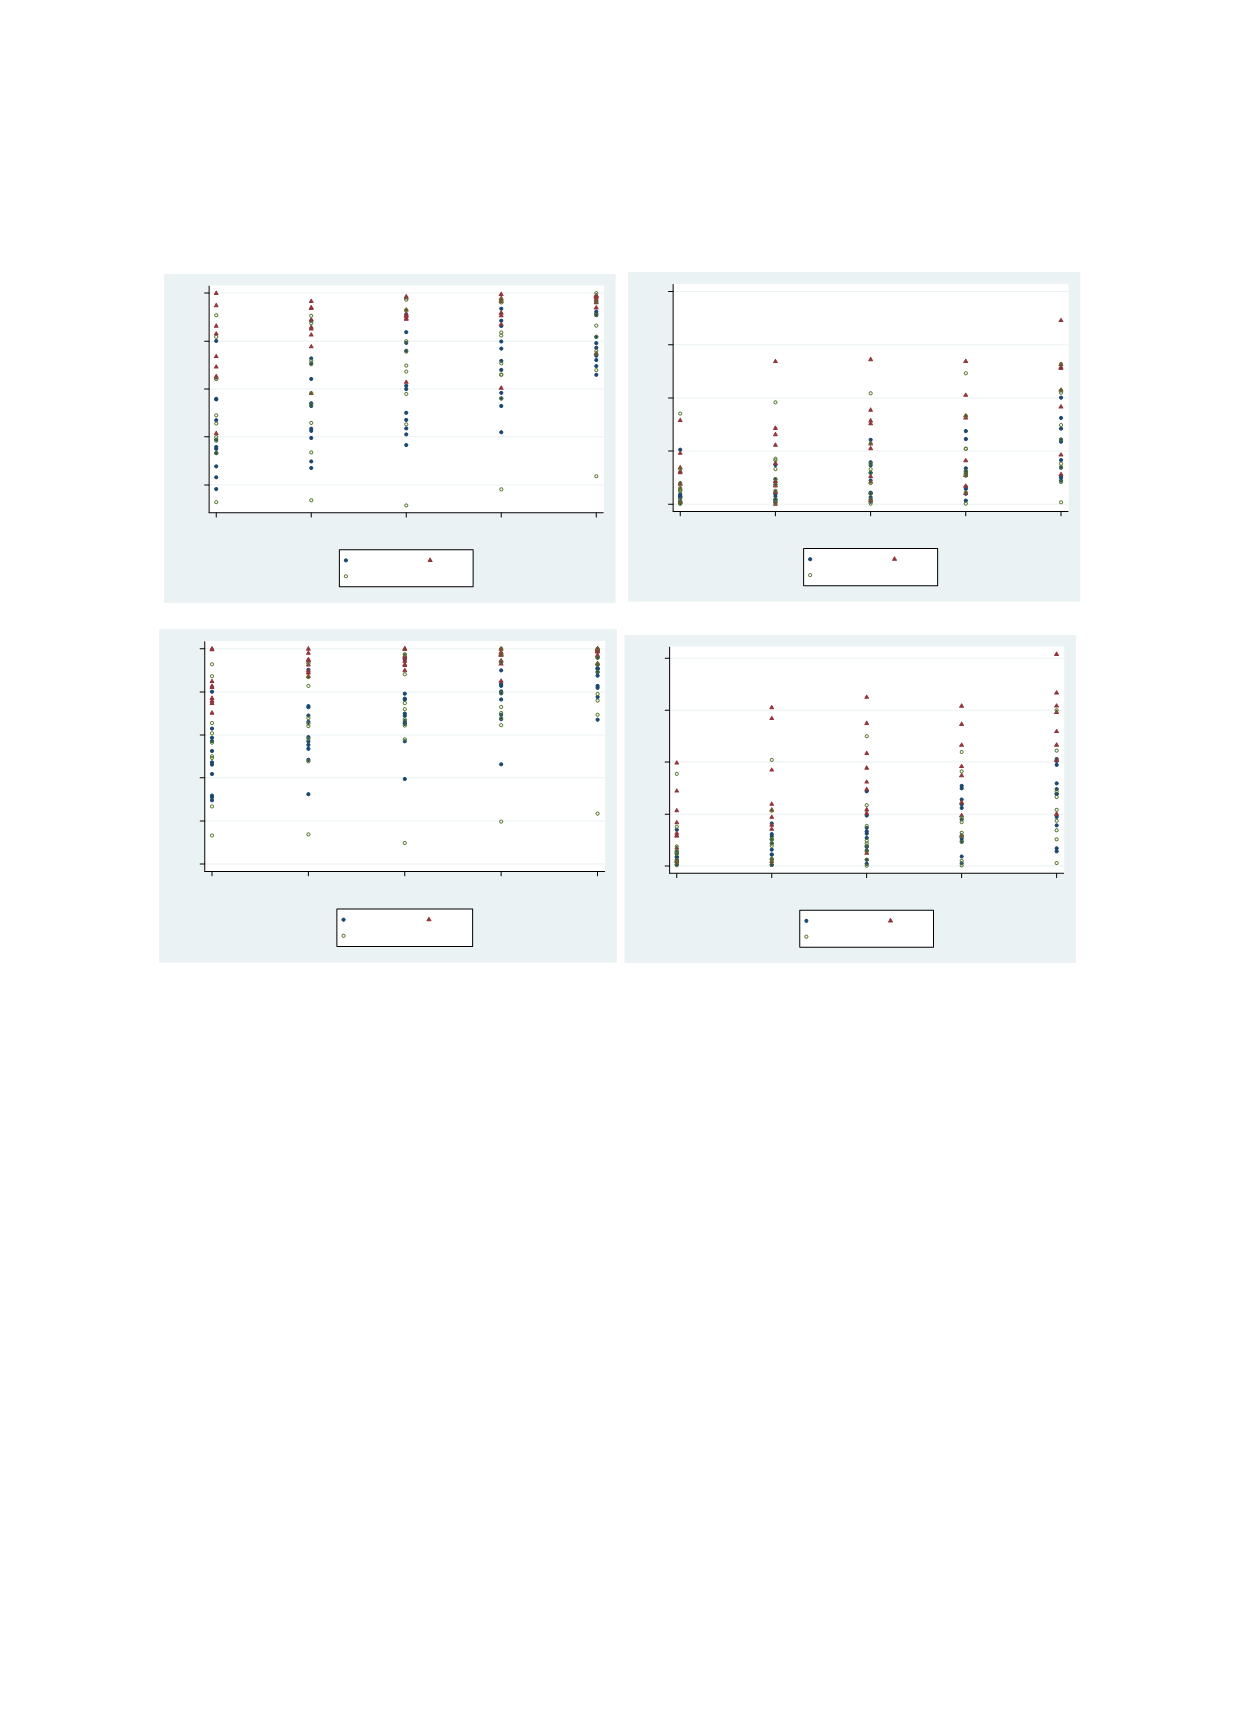
Figure 2.24: Wealth Gradient of Learning Levels in Urban OIC vs Rural OECD and Non-OECD,
TIMSS 2011
Source:
Author’s calculation. Wealth quintiles are country specific.
Figures 2.21-2.23
together highlight enormous disparities in learning opportunities within the
OIC. At the same time, country-wise analysis reveals some powerful patterns.
Figure 2.24
presents data on the proportion of children crossing specific achievement threshold across the
full-range of wealth quintiles in OIC countries in TIMSS 2011. For comparison, non-OIC countries
are highlighted though without country labels. The wealth gap in OIC countries is quite large. In
Morocco, around 30% children from the poorest quintile pass the level-1 threshold in science
compared to over 60% children from the wealthiest quintile. At the same time, within OIC
disparity in performance of children from a given wealth group is also very large. In terms of
basic proficiency inmath, Kazakh children from the poorest wealth quintile outperform children
from the wealthiest group in Jordan and Qatar. The proportion of children in the bottom wealth
group in Kazakhstan achieving basic proficiency in math and science is also twice that of
Malaysia. However, in the case of advanced knowledge in math, children underperform across
all wealth groups, both in Kazakhstan and Qatar. Similarly, children from the wealthiest group
in Kazakhstan outperform those from Qatar in basic reading proficiency though the gap
disappears in case of advanced reading skills. Only children from Turkey demonstrate a
systematic wealth advantage in case of advanced reading skills in PISA 2012. The contrasting
gap between wealth groups in a country and children of member states within the same wealth
group suggests that school quality is a bigger concern than poverty in influencing student
achievement in basic science and math proficiency in OIC countries.
BHR
BHR
BHR
BHR
BHR
IDN
IDN
IDN
IDN
IDN
JOR
JOR
JOR
JOR
JOR
KAZ
KAZ
KAZ
KAZ
KAZ
LBN
LBN
LBN
LBN
LBN
MYS
MYS
MYS
MYS
MYS
MAR
MAR
MAR
MAR
MAR
OMN
OMN
OMN
OMN
OMN
QAT
QAT
QAT
QAT
QAT
SAU
SAU
SAU
SAU
SAU
ARE
ARE
ARE
ARE
ARE
.2
.4
.6
.8
1
1
2
3
4
5
wealth quintiles
OIC
OECD
NON-OECD
BHR
BHR
BHR
BHR
BHR
IDN
IDN
IDN
IDN
IDN
JOR
JOR
JOR
JOR
JOR
KAZ
KAZ
KAZ
KAZ
KAZ
LBN
LBN
LBN
LBN
LBN
MYS
MYS
MYS
MYS
MYS
MA
MAR
MAR
MAR
MAR
MN
OMN
OMN
OMN
OMN
QAT
QAT
QAT
QAT
QAT
SAU
SAU
SAU
SAU
SAU
ARE
ARE
ARE
ARE
ARE
0
.2
.4
.6
.8
% of children passing level-3 maths threshold
1
2
3
4
5
wealth quintiles
OIC
OECD
NON-OECD
BHR
BHR
BHR
BHR
BHR
IDN
IDN
IDN
IDN
IDN
JOR
JOR
JOR
JOR
JOR
KAZ
KAZ
KAZ
KAZ
KAZ
LBN
LBN
LBN
LBN
LBN
MYS
MYS
MYS
MYS
MYS
MAR
MAR
MAR
MAR
MAR
OMN
OMN
OMN
OMN
OMN
QAT
QAT
QAT
QAT
QAT
SAU
SAU
SAU
SAU
SAU
ARE
ARE
ARE
ARE
ARE
0
.2
.4
.6
.8
1
1
2
3
4
5
wealth quintiles
OIC
OECD
NON-OECD
BHR
BHR
BHR
BHR
BHR
IDN
IDN
IDN
IDN
IDN
JOR
JOR
JOR
JOR
JOR
KAZ
KAZ
KAZ
KAZ
KAZ
LB
LBN
LBN
LBN
LBN
MYS
MYS
MYS
MYS
MYS
MAR
MAR
MAR
MAR
MAR
OMN
OMN
OMN
OMN
OMN
QAT
QAT
QAT
QAT
QAT
SAU
SAU
SAU
SAU
SAU
ARE
ARE
ARE
ARE
ARE
0
.2
.4
.6
.8
% of children passing level-3 science threshold
1
2
3
4
5
wealth quintiles
OIC
OECD
NON-OECD


