
39
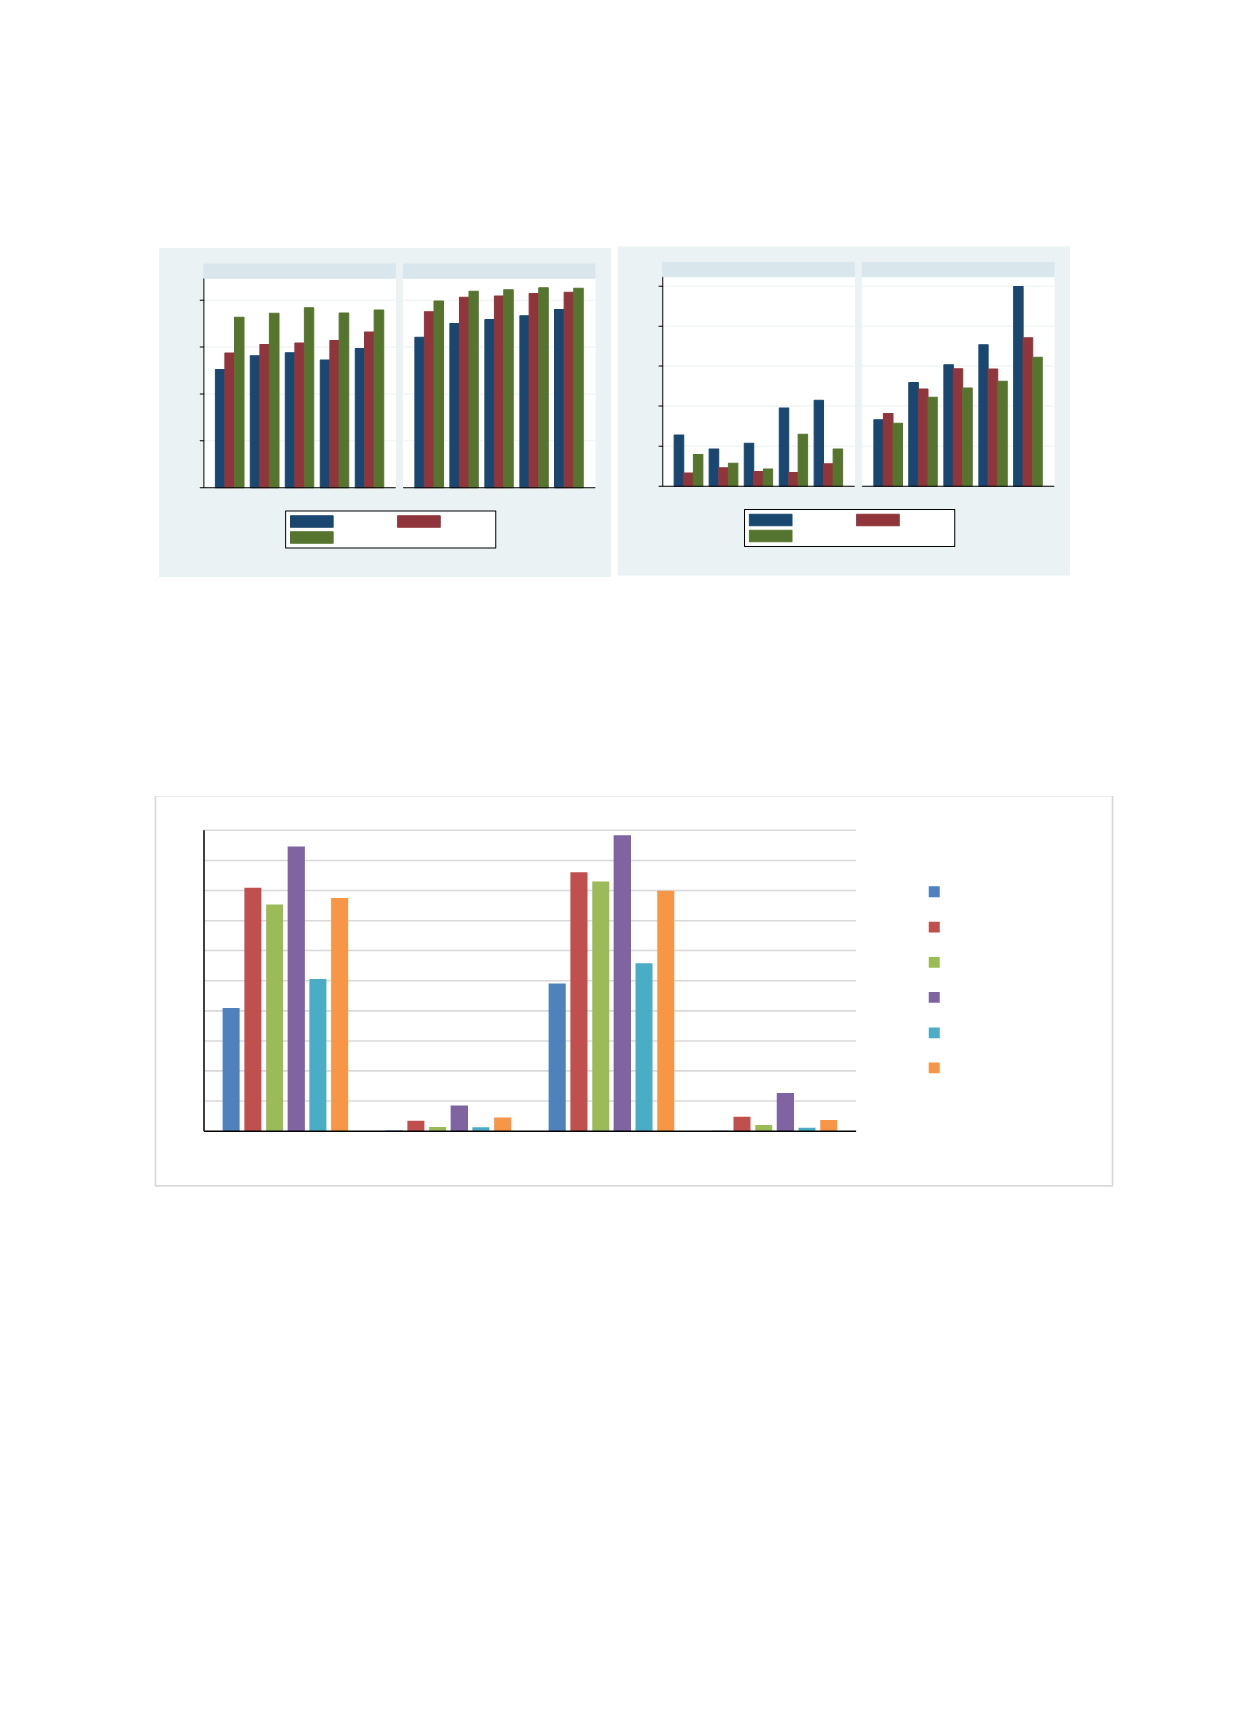
Figure 2.20: Wealth-Learning Profile, PISA 2000 and 2012
Overall,
Figures 2.19 and 2.20
document widening wealth gaps in student achievement among
OIC countries participating in TIMSS. Similar gaps are also noticeable in PISA data though the
rich-poor gaps are narrower compared to TIMSS. But how large are these gaps relative to
participating OECD and non-OECD countries? This issue is addressed next in
Figure 2.21
.
Figure 2.21: Learning Levels of Children from Top and BottomWealth Groups in Urban OIC
vs. Rural OECD and Non-OECD, TIMSS 2011
Source: Author’s calculation based on WIDE database
Since OECD and some participating non-OECD countries are wealthier, comparison to the latter
is based on students from rural locations. On the other hand, data on OIC children are restricted
to those living in urban locations. Figure 2.21 plots TIMSS 2011 performance data for urban OIC
against rural children from OECD and non-OECD countries. A number of patterns are
noteworthy. First, the top-bottom wealth gap there is very large among urban children in OIC
countries even in basic mathematics competency. Over 40% children from the bottom wealth
quintile attain basic competency in math against more than 80% from top wealth quintile. There
is also a large gap in science though it’s slightly narrower compared to math. Second, wealth gap
is also present in non-OIC countries. However, the gap is much smaller in the OECD as well as
non-OECD countries. Considering the fact that the non-OIC sample corresponds to rural
population, this suggests that families in OIC countries suffer from the double burden of poor
0
.2
.4
.6
.8
1
2
3
4
5
1
2
3
4
5
Country Wealth Index Quintiles, 2000 Country Wealth Index Quintiles, 2012
Maths
Reading
Science
Graphs by category and year
0
.02
.04
.06
.08
.1
1
2
3
4
5
1
2
3
4
5
Country Wealth Index Quintiles, 2000 Country Wealth Index Quintiles, 2012
Maths
Reading
Science
% of children passing level-4 threshold
Graphs by category and year
0
0,1
0,2
0,3
0,4
0,5
0,6
0,7
0,8
0,9
1
math, level1
math, level3
science, level1 science, level3
OIC, urban q1
OIC, urban q5
OECD, rural q1
OECD, rural q5
NOECD, rural q1
NOECD, rural q5


