
38
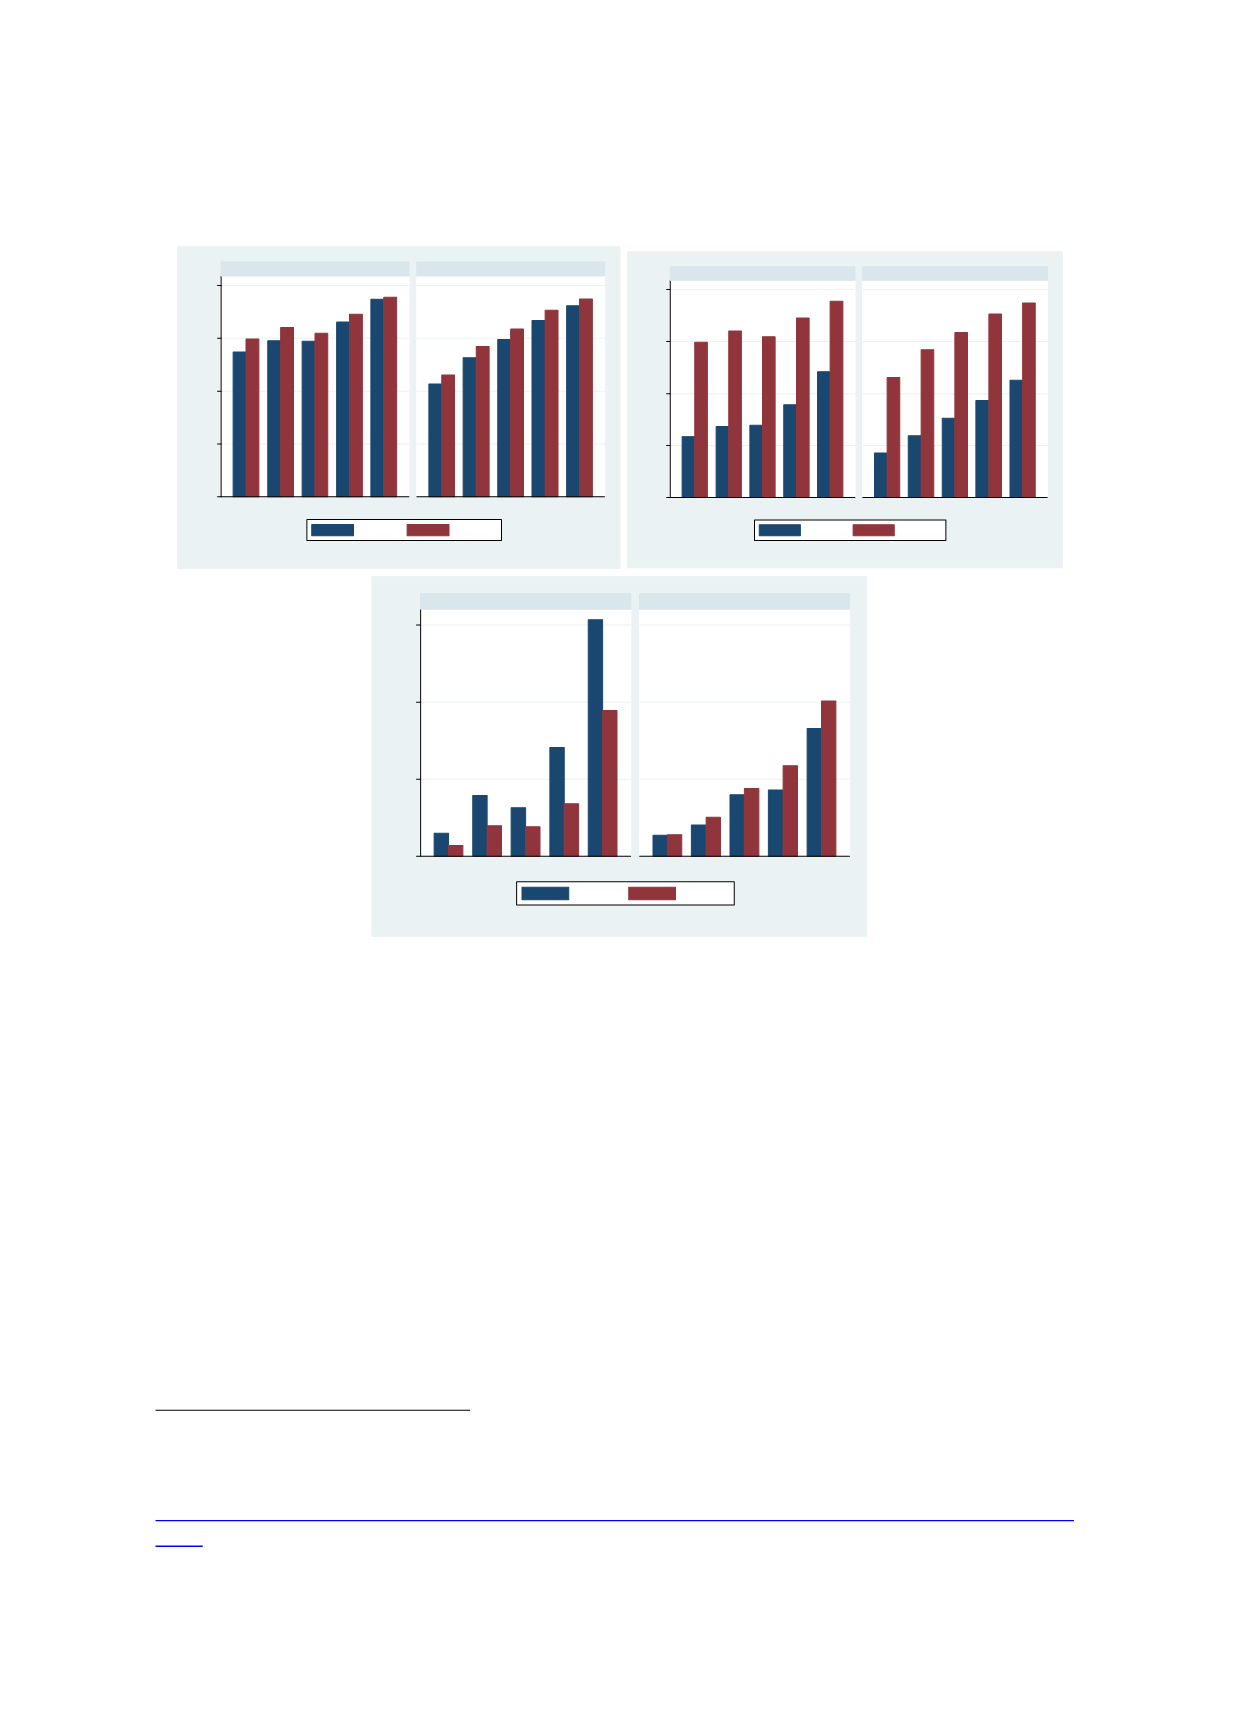
Figure 2.19: Wealth-Learning Profile in the OIC, TIMSS 1999 and 2011
Source: Author’s calculation based on WIDE data
Similar patterns are obtained for PISA 2012 data. The average for participating OIC countries in
2000 show levels of attainment in terms of basic proficiency (level 1) in science, math and
reading.
4
While there is a wealth gap with children from highest wealth quintiles performing
better, also noticeable is an across wealth group increase in level 1 proficiency by 2012. This is
also noticeable in case of level-4 proficiency. In 2000 round, the majority in the participating OIC
sample countries had very low level of competencies achieved regardless of the wealth group.
In 2012, there has been a sharp rise in proficiency though the wealth gap has also widened.
4
There are in total six levels of proficiency in PISA data. The improvement required for an education
system to progress from one level to another approximately equivalent to 38 points or one school
year equivalent. For the construction of proficiency scales, see:
https://www.oecd.org/pisa/pisaproducts/PISA%202012%20Technical%20Report_Chapter%201 5.pdf0
.2
.4
.6
.8
1
2
3
4
5
1
2
3
4
5
Country Wealth Index Quintiles, 1999 Country Wealth Index Quintiles, 2011
Maths
Science
Graphs by category and year
0
.2
.4
.6
.8
1
2
3
4
5
1
2
3
4
5
Country Wealth Index Quintiles, 1999 Country Wealth Index Quintiles, 2011
Maths
Science
% of children passing level-2 threshold
Graphs by category and year
0
.02
.04
.06
1
2
3
4
5
1
2
3
4
5
Country Wealth Index Quintiles, 1999 Country Wealth Index Quintiles, 2011
Maths
Science
% of children passing level-3 threshold
Graphs by category and year


