


 110 / 236

Preferential Trade Agreements and Trade Liberalization Efforts in the OIC Member States
With Special Emphasis on the TPS-OIC
88
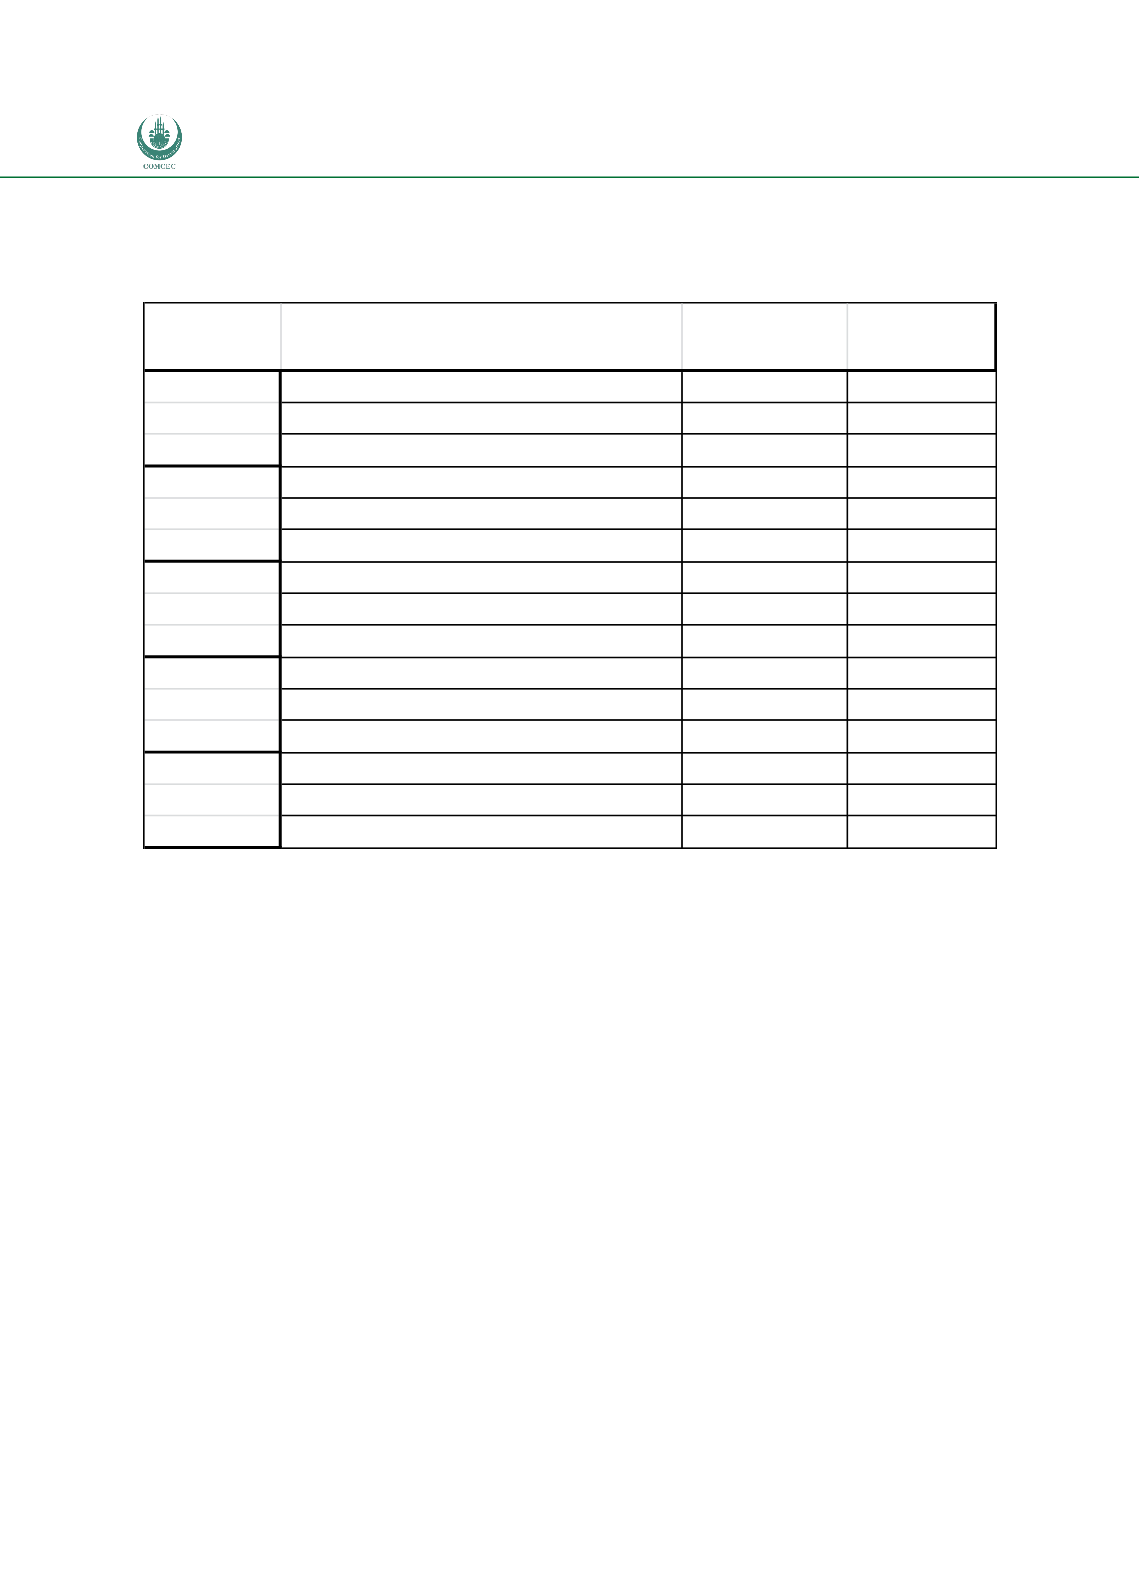
Table 11: Main Products Exported to OIC Countries and Key OIC Partners by Countries
with Highest Shares of OIC Exports in their Total Exports, 2010
Country Main exports to OIC (HS 4 digit code)
Share of X to
OIC
OIC X
partners
Meat edible offal (0207)
31%
Nigeria*
Benin Rice (1006)
30%
Chad
Cotton not carded or combed (5201)
10%
Indonesia
Cement (2523)
24%
Benin*
Togo Fertilizer mixtures (3105)
10% Burkina Faso*
Containers, etc, of plastic (3923)
10%
Ghana*
Commodities not specified (9999)
36%
Pakistan*
Afghanistan Carpets etc (5701)
26%
Turkey
Oil seeds, fruits (1207)
10%
Iran*
Oils petroleum,except crude (2710)
26%
Mali*
Senegal
Cement (2523)
17%
Guinea*
Soups, broths, food preparations (2104)
4%
Gambia*
Medicaments, etc (3004)
12%
Iraq*
Jordan Tomatoes, fresh or chilled (0702)
7% Saudi Arabia
Mineral or chemical fertilizer (3104)
6%
UAE
Source: Comtrade via WITS. Note: * denotes a neighbouring country (common land border)