
Preferential Trade Agreements and Trade Liberalization Efforts in the OIC Member States
With Special Emphasis on the TPS-OIC
85
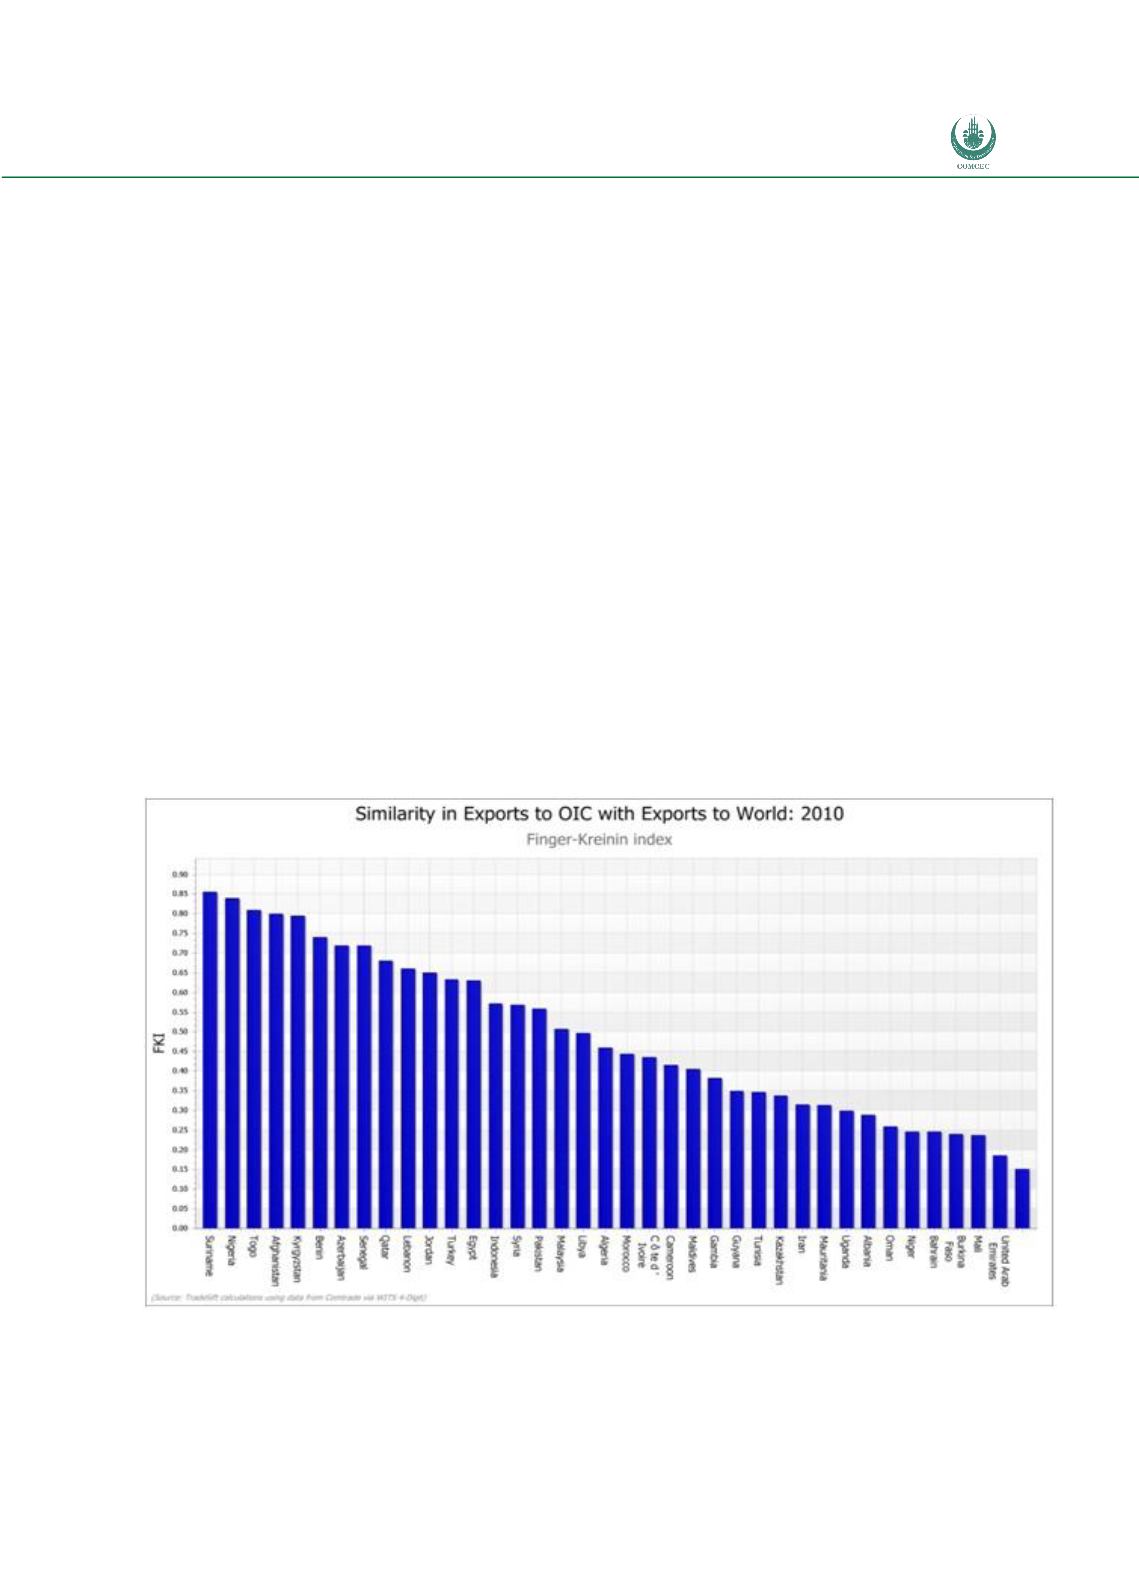
the structure of trade across the destinations was identical, then the index would be equal to 1;
if the structure of trade was completely different than the index would be equal to 0.
As can be seen from the chart above the degree of similarity varies substantially across
countries. For 17 countries the degree of similarity is 50% or more; whereas for the remaining
countries it is less. Where the degree of similarity is high, in a few instances this is because the
countries are highly specialised in a few commodities which dominates the overall structure of
their trade. Figure 13 below identifies for every one of the 17 countries separately the export
share of the main product category (HS chapter 2 digit) exported to the OIC countries in 2010,
along with the export share of this same product category to the rest of the world (RoW). It is
evident that dominance of few commodities in overall exports can be observed in Nigeria,
Azerbaijan and Qatar (all mainly exporting products classified as under HS27, Mineral fuels,
oils, distillation products to both OIC and the rest of the world), Kyrgyzstan (mainly exporting
gold to both OIC and the rest of the world) and possibly Suriname (where, however, main
export category is HS 99, Commodities not specified according to kind, that may suggest
problems in data quality). In other of these 17 countries, the situation is less clear-cut and high
similarity of exports to OIC and the world as a whole can be observed despite more diversified
overall export structure.
Figure 12:
Similarity in the Exports of the OIC to the OIC and the World,
2010


