


 111 / 236

Preferential Trade Agreements and Trade Liberalization Efforts in the OIC Member States
With Special Emphasis on the TPS-OIC
89
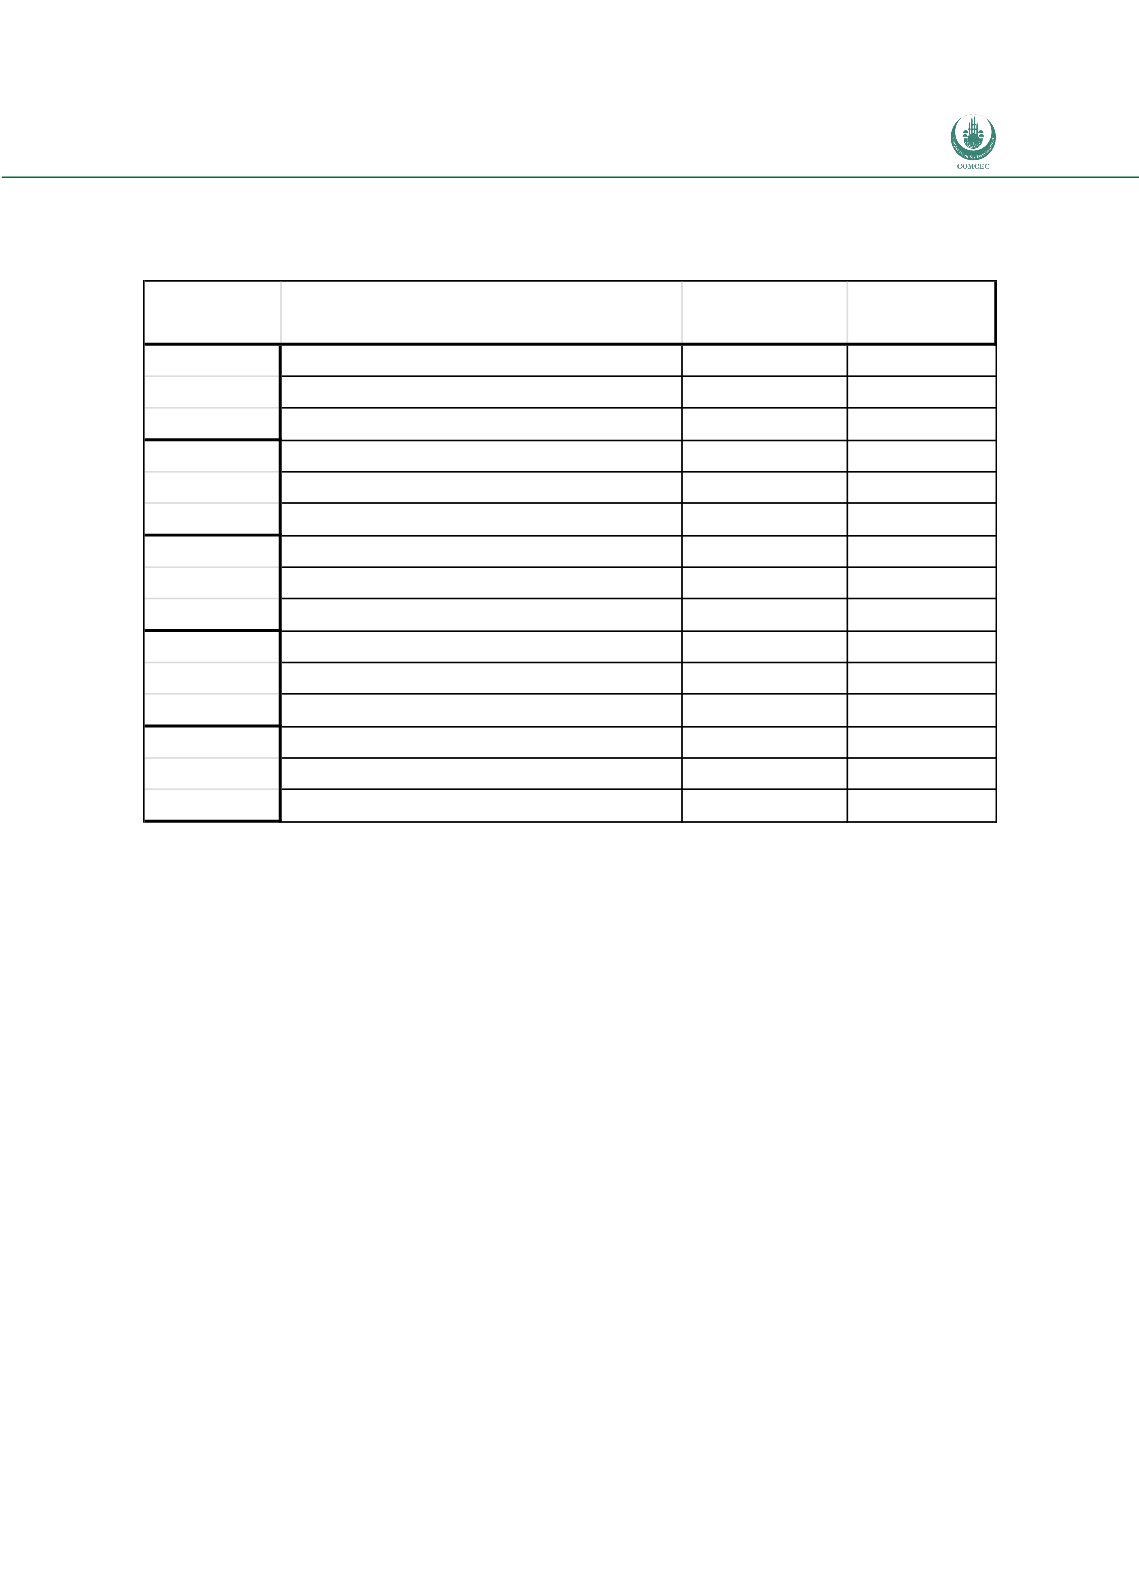
Table 12:
Main products imported from OIC countries and key OIC partners by countries
with highest shares of OIC imports in their total imports, 2010
Country Main exports to OIC (HS 4 digit code)
Share of X to
OIC
OIC X
partners
Oils petroleum (2710)
34% Uzbekistan*
Afghanistan Commodities nes (9999)
29%
Pakistan*
Wheat or meslin flour (1101)
8%
Iran*
Oils petroleum (2710)
41%
UAE
Pakistan Petroleum oils crude (2709)
21% Saudi Arabia*
Palm oil (1511)
10%
Kuwait
Petroleum oils, crude (2709)
30% Saudi Arabia*
Jordan
Oils petroleum (2710)
11%
Egypt
Petroleum gases etc (2711)
8%
Turkey
Oils petroleum (2710)
12%
UAE*
Oman
Baked bread.. (1905)
3% Saudi Arabia*
Parts for lifting, moving machy (8431)
3%
Kuwait
Iron and non-alloy steel (7206)
8%
UAE
Iran Hot-rolled products, iron/steel (7208)
4%
Turkey*
Commodities not specified (9999)
4%
Source: Comtrade via WITS. Note: * denotes a neighbouring country (common land border)
As well as looking at changes in the amount of trade over time, it is also interesting to consider
the changing composition of trade. To do this we take the OIC-2000 group and compare the
structure of trade in the year 2000 with the structure of trade in 2010. We find that for the
OIC-2000 group, the index is equal to 0.6 for total exports, and 0.56 if we consider non-oil and
gas exports. Hence this suggests that there is approximately a 55%-60% overlap in the
structure of trade when comparing 2000 with 2010. By way of comparison if the same
calculation is done for the exports of the EU27, the US and China the corresponding figures are
0.65, 0.78 and 0.57. This suggest that the OIC countries have seen a greater change in the
composition of their exports over time in comparison to the EU and the US, and a similar
degree of restructuring as that experienced by China.
Overview of Tariff Trends
A central issue when considering the possible impact of further integration concerns the level
of barriers to trade between countries. The main data that we have on such barriers, is data on
tariffs (and tariff levels are often highly correlated with non-tariff barriers for reasons of
domestic political economy).