


 105 / 236

Preferential Trade Agreements and Trade Liberalization Efforts in the OIC Member States
With Special Emphasis on the TPS-OIC
83
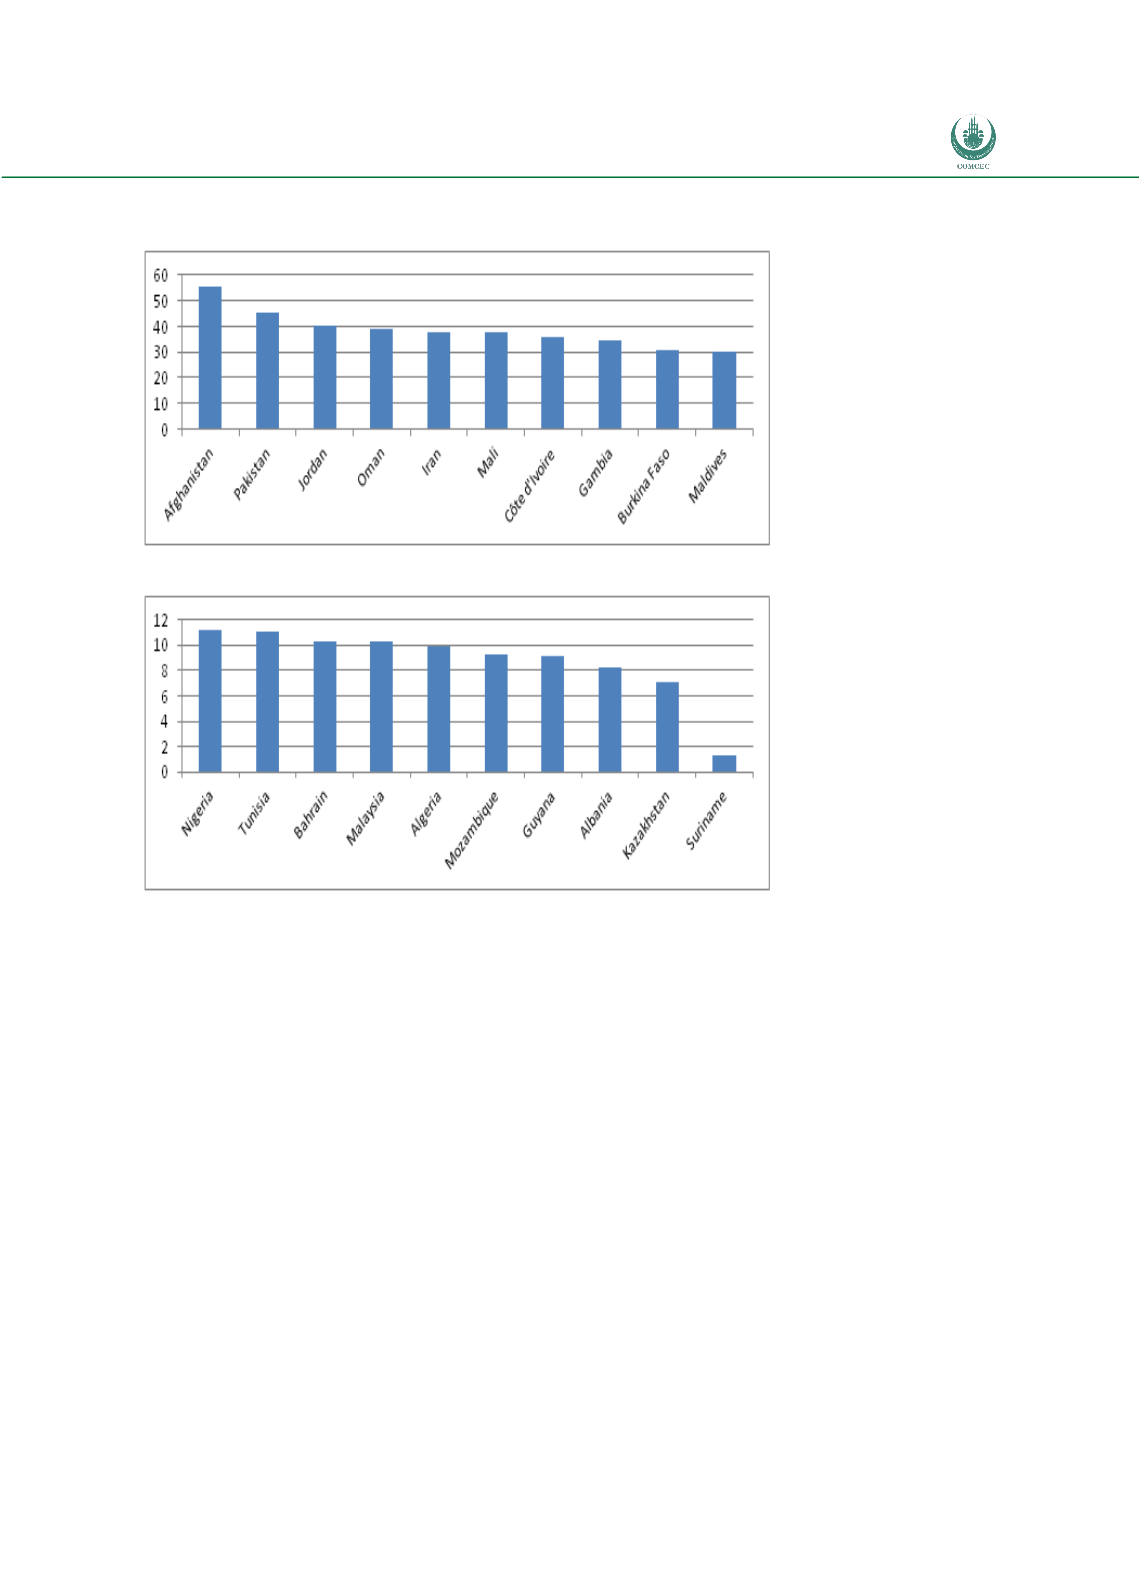
Figure 11:
OIC Countries with the Highest (upper panel) and Lowest (lower panel) Share of
Import from the OIC countries, 2010
Source: Comtrade data via WITS
Sectoral Breakdown of Intra-OIC trade
The preceding section was very much focussed on aggregate trade. It is also important,
however, to look at the commodity composition of trade. When considering the sectoral break-
down by SITC 1-digit categories in the intra-OIC imports over time we see some changes but
relative stability over time. There has been a decline in the share of Food and Live Animals
(from 11.4% to 4.8%), Crude materials (from 7.1% to 3.2%) and Mineral Fuels (from 47.8% to
41.8%) in the intra-OIC imports; and correspondingly an increase in the share of Chemicals
(from 8.8% to 13.4%) and Commodity and transactions nes (from 0.1% to 9.2%). Once again, it
is worth noting that these shares will in part be impacted by country compositional changes.
Examining the sectoral breakdown of intra-OIC exports Table 10 shows the growing
importance of Mineral Fuels (from 9.4% to 18.5% of total intra-OIC exports), Machinery and
Transport equipment (from 8.0% to 16.3%), and Miscellaneous manufactured goods (from
7.0% to 11.4%). The shares seeing the biggest decline in their share have been Food and Live
Animals (from 18.7% to 10.1%) and Manufactured Goods classified chiefly by material (from