


 109 / 236

Preferential Trade Agreements and Trade Liberalization Efforts in the OIC Member States
With Special Emphasis on the TPS-OIC
87
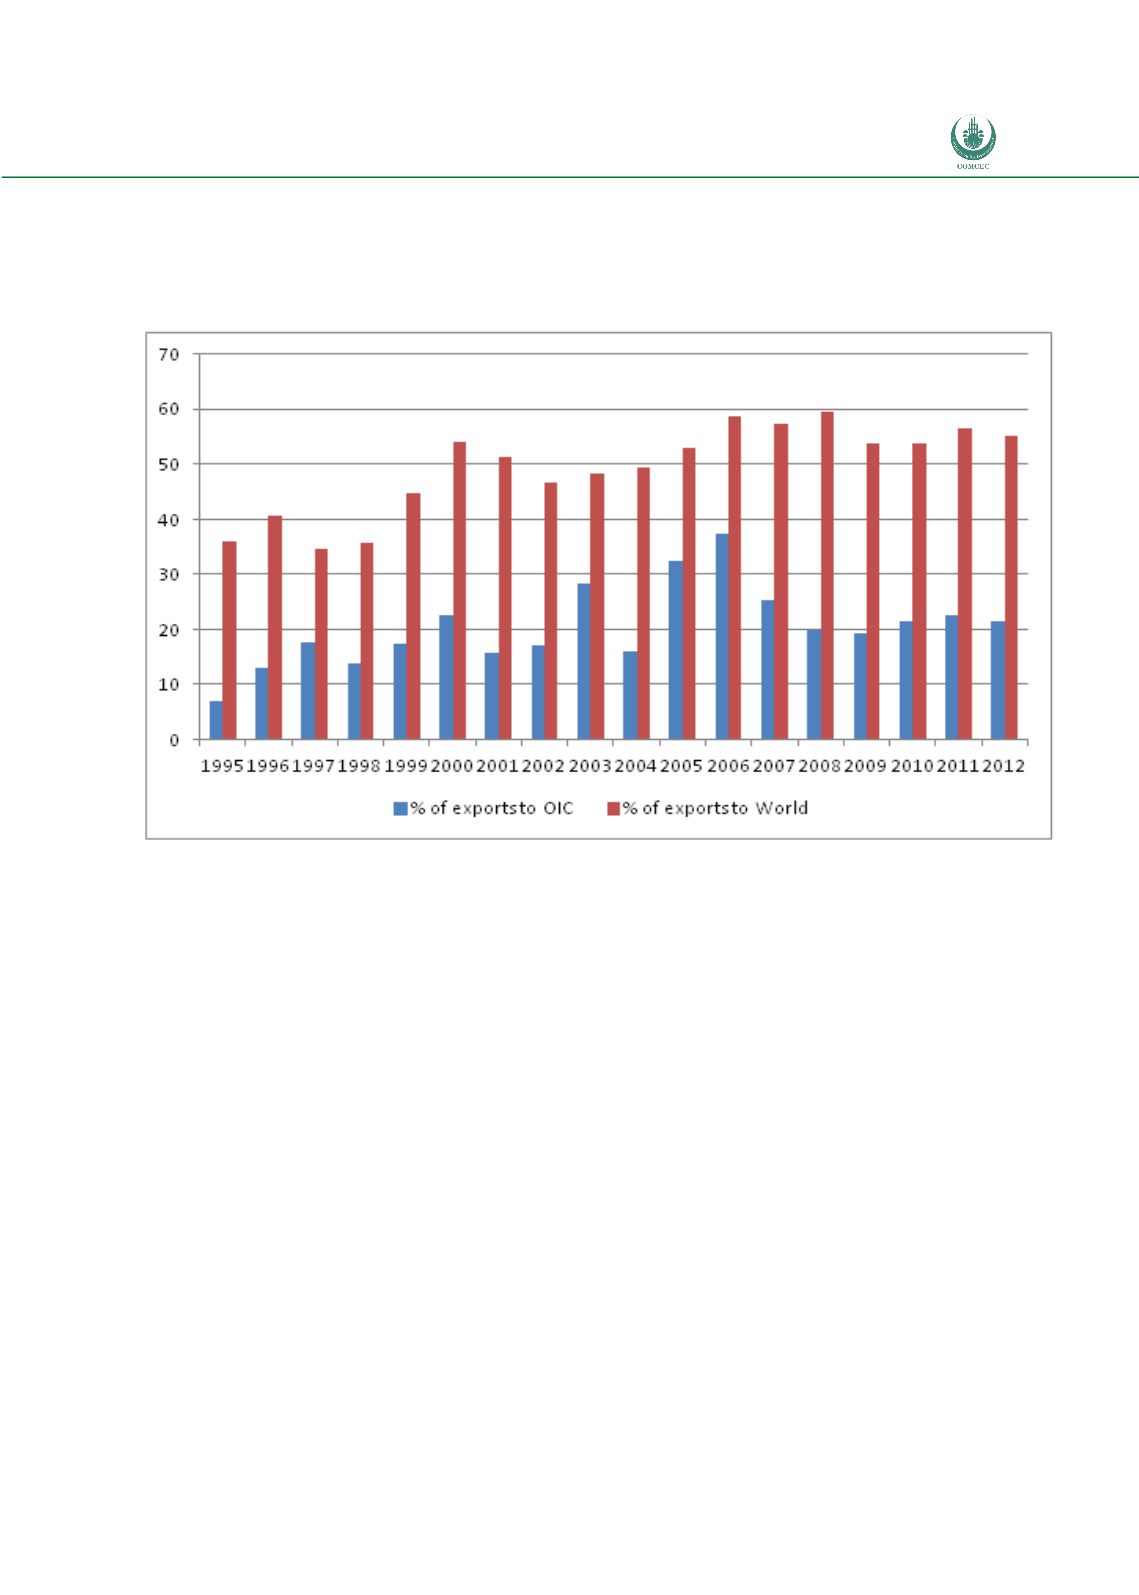
products classified under HS chapter 27 (Mineral fuels, oils, distillation products) account for
more than half of total OIC exports to the world but just around 20% of intra-OIC exports.
Figure 14: % share of HS27 in OIC Exports to Other OIC Countries and the World, 1995-2012
Source: Comtrade data via WITS
It is interesting to see in some more detail the commodity structure and trade directions of
countries with the highest share of intra-OIC exports and imports. Among five countries with
the highest share of OIC in total exports, the main partners are typically neighbouring or
closely located countries. For instance in the case of Togo, three main export partners are
simply three countries that Togo borders with. There is just one pair of faraway countries in
Table 11 below, with 10% of Benin’s exports going to Indonesia. This is not surprising given
the important role of distance in determining trade flows. The principal export products differ
between countries reflecting varying economic structures across those countries.
Repeating the analogous exercise for the five countries with the highest share of imports from
OIC in total imports reveals that these are often countries importing oil and oil products
(Afghanistan, Pakistan and Jordan). The OIC import structures of Oman and Iran are more
diversified. Distance also appears to play an important role, possibly less so in the case of oil
imports. It is worth observing that most of the countries in Table 12 border with several other
OIC economies.