


 115 / 236

Preferential Trade Agreements and Trade Liberalization Efforts in the OIC Member States
With Special Emphasis on the TPS-OIC
93
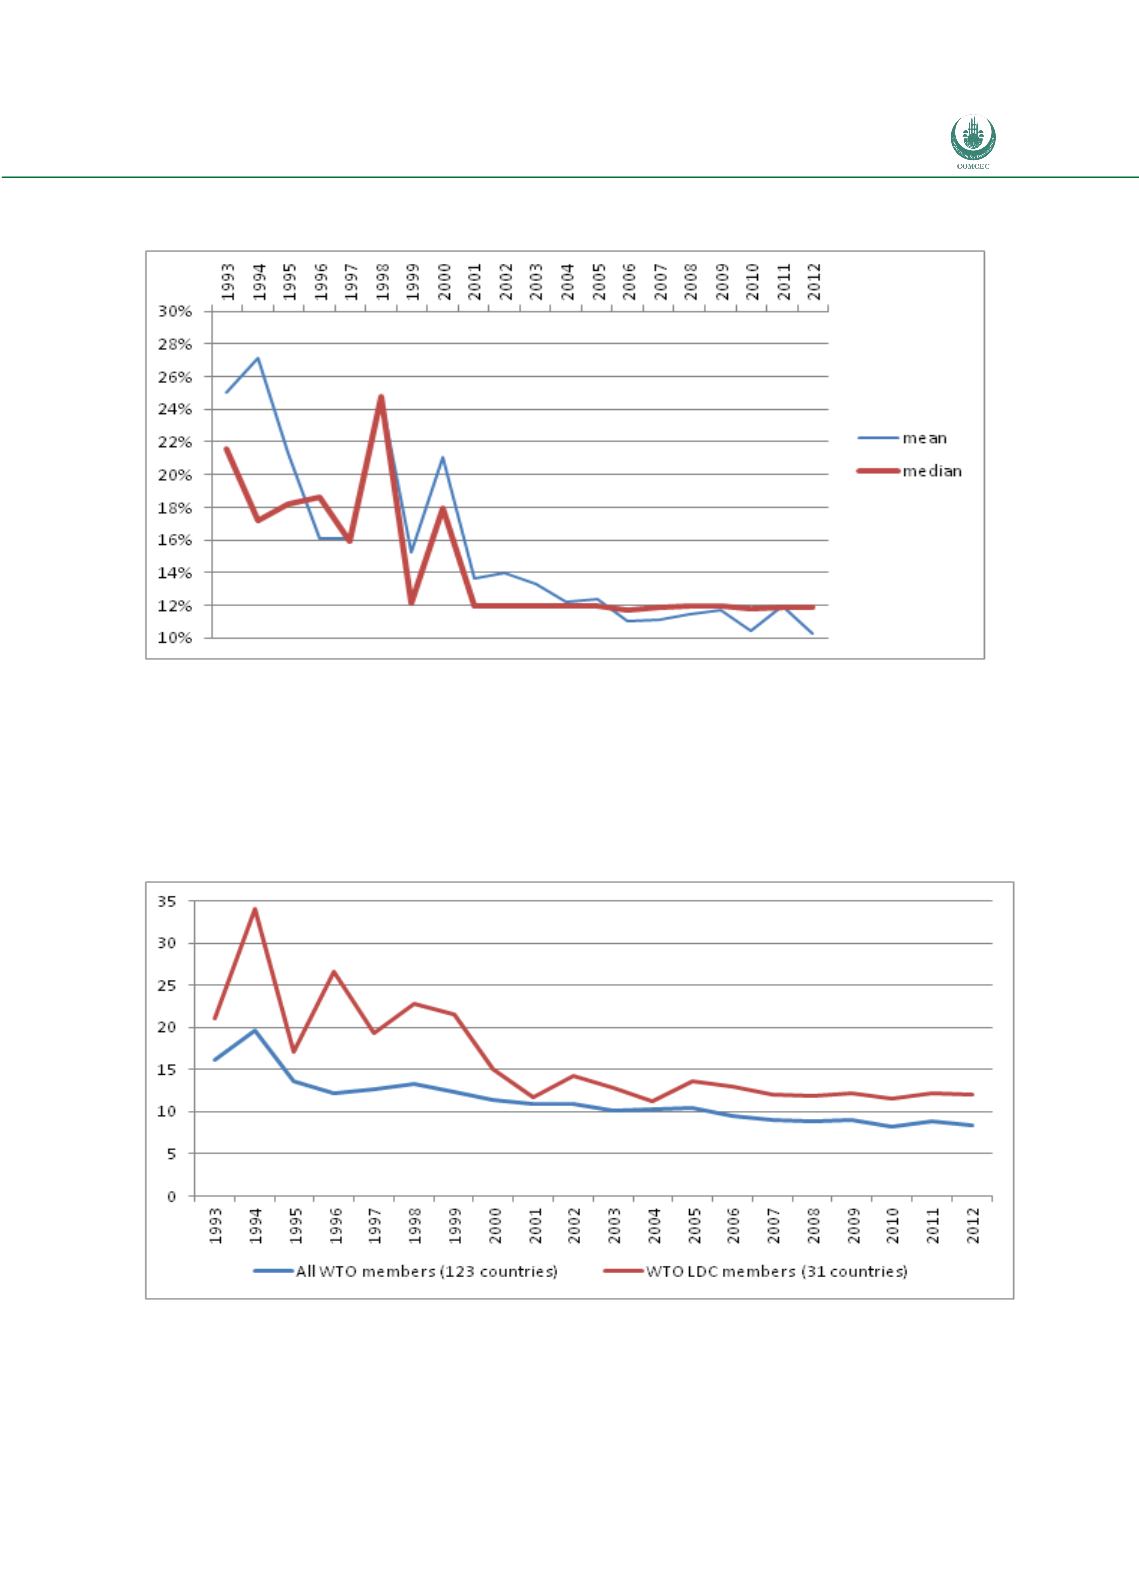
Figure 16:
Change in Simple Average MFN Tariff Rates for OIC Countries, 1993-2012 (%)
Source: Calculations based on TRAINS data obtained via WITS
Note: The number of countries reporting data changes between years. During 1990s data are available
for relatively few countries making it difficult to interpret changes from one year to another. For the
same reason, the median rather than a mean is more likely to provide a better indication of changes during
1990s.
Figure 17:
Change in Simple Average MFN Tariff Rates for Selected Country Groups, 1993-
2012 (%)
Source: TRAINS data via WITS
Notes: the values plotted are average of simple average MFN rates for selected country groups. LDC
stands for least developed country