


 108 / 236

Preferential Trade Agreements and Trade Liberalization Efforts in the OIC Member States
With Special Emphasis on the TPS-OIC
86
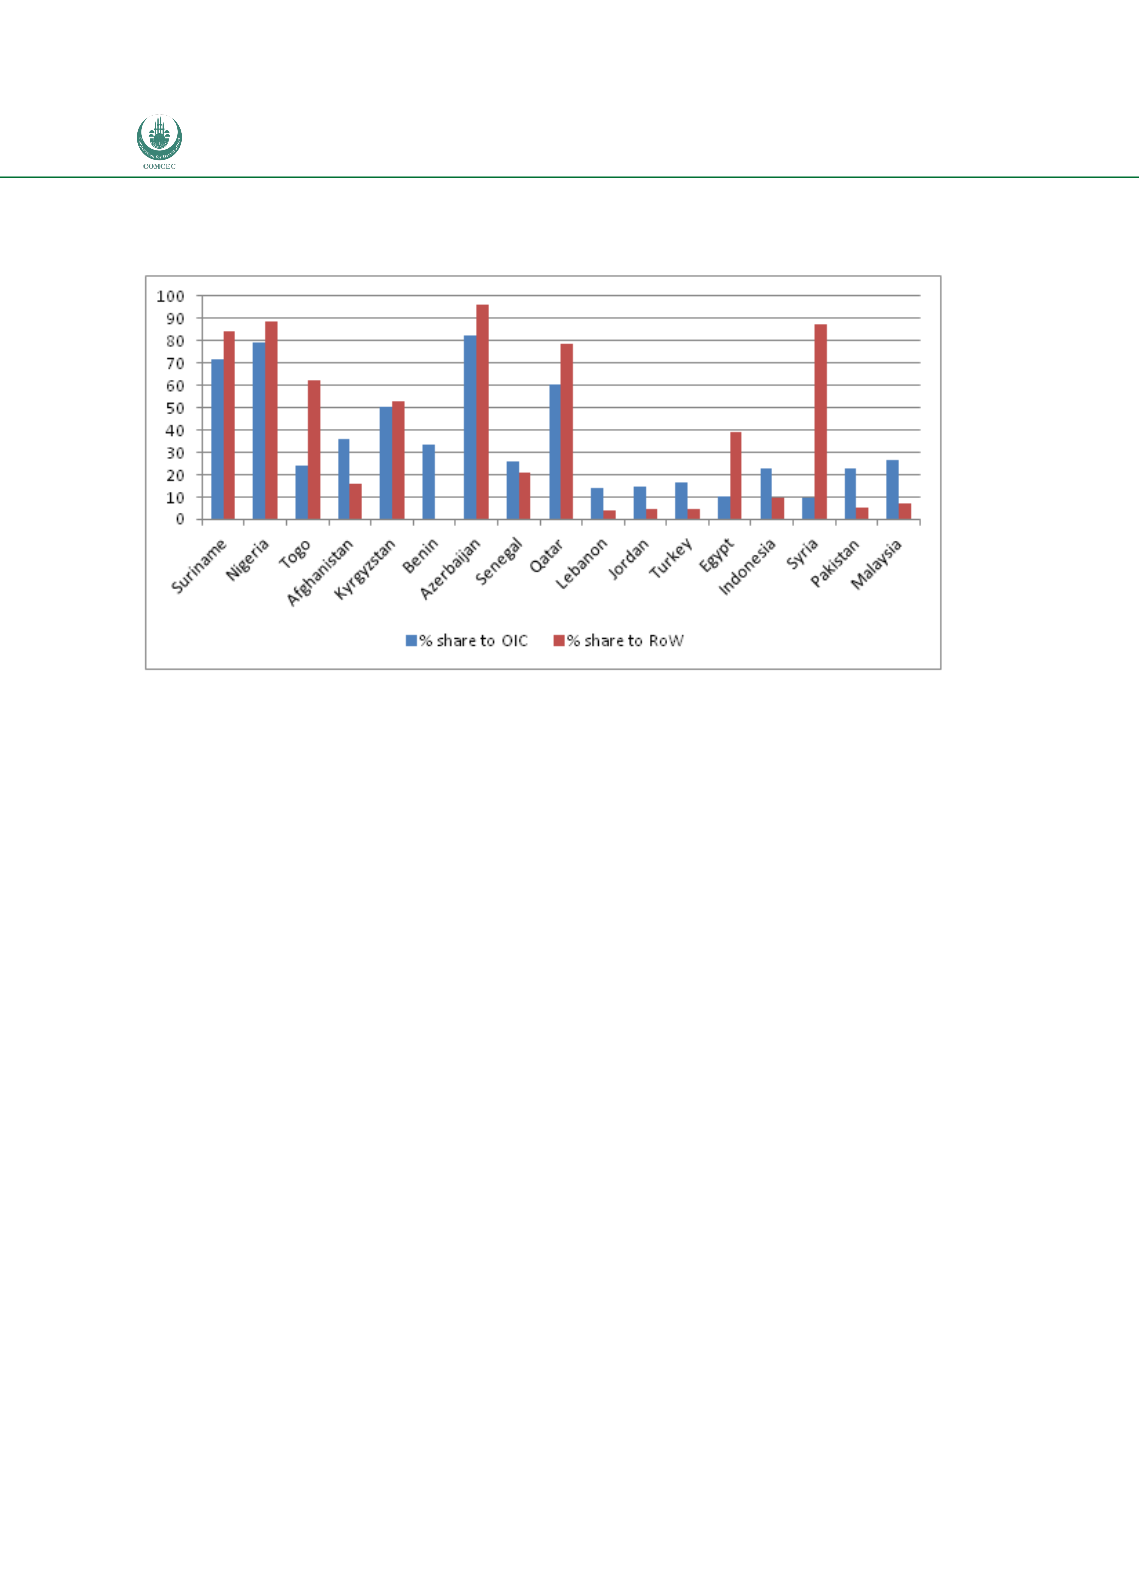
Figure 13: Concentration of Main Exports to OIC in 2010: % Share of top HS 2-digit product group
(by country) exported to OIC in total exports to OIC, and in total exports to the rest of the world
Source: Comtrade data via WITS
Note: For the indicated countries, data are for HS chapter that has the highest share in 2010 exports to OIC.
The following are the main OIC export product categories: Commodities not specified according to kind
(Suriname and Afghanistan); Mineral fuels, oils, distillation products. (Nigeria, Azerbaijan, Senegal, Qatar,
Egypt, and Syria); Salt, sulphur, earth, stone, plaster, lime ... (Togo); Pearls, precious stones, metals, coins, etc
(Kyrgyzstan); Cereals (Benin, Pakistan); Nuclear reactors, boilers, machinery, etc (Lebanon); Pharmaceutical
products (Jordan), Iron and steel (Turkey); Animal, vegetable fats and oils, cleavage pr... (Indonesia, Malaysia).
Where the structure of exports to OIC and the world is very different this suggests that
countries may be quite highly specialised in what they export to particular OIC partners or to
the contrary, that they are highly specialised in exports to the world but their exports to OIC
partners are more diversified. This could be either because of differences in demand, or in
distance and transport costs; or it could be because of differences in the degree of preferences
offered in those markets or barriers to sell to specific markets. For instance Mali exports to
non-OIC countries are dominated by gold (with a slightly broader category Pearls, precious
stones, metals, coins, etc taking 94% share in total non-OIC exports in 2010). In contrast, its
main exports to OIC countries are cotton (40% of 2010 exports) and live animals (26%).
Similarly, in the case of Niger ores, slag and ash (HS26) dominate non-OIC exports (61% share
in 2010), while hardly being exported at all to OIC partners. At the same time live animals
account for more than half of Niger exports to OIC countries when practically not being
exported to non-OIC markets. In the case of UAE and Oman mineral fuels dominate exports to
non-OIC countries but exports to OIC members are more diversified.
One important difference in terms of commodity structure of intra-OIC exports and OIC
exports to the world is in the role played by mineral fuels. As shown in Figure 14 below