


 102 / 236

Preferential Trade Agreements and Trade Liberalization Efforts in the OIC Member States
With Special Emphasis on the TPS-OIC
80
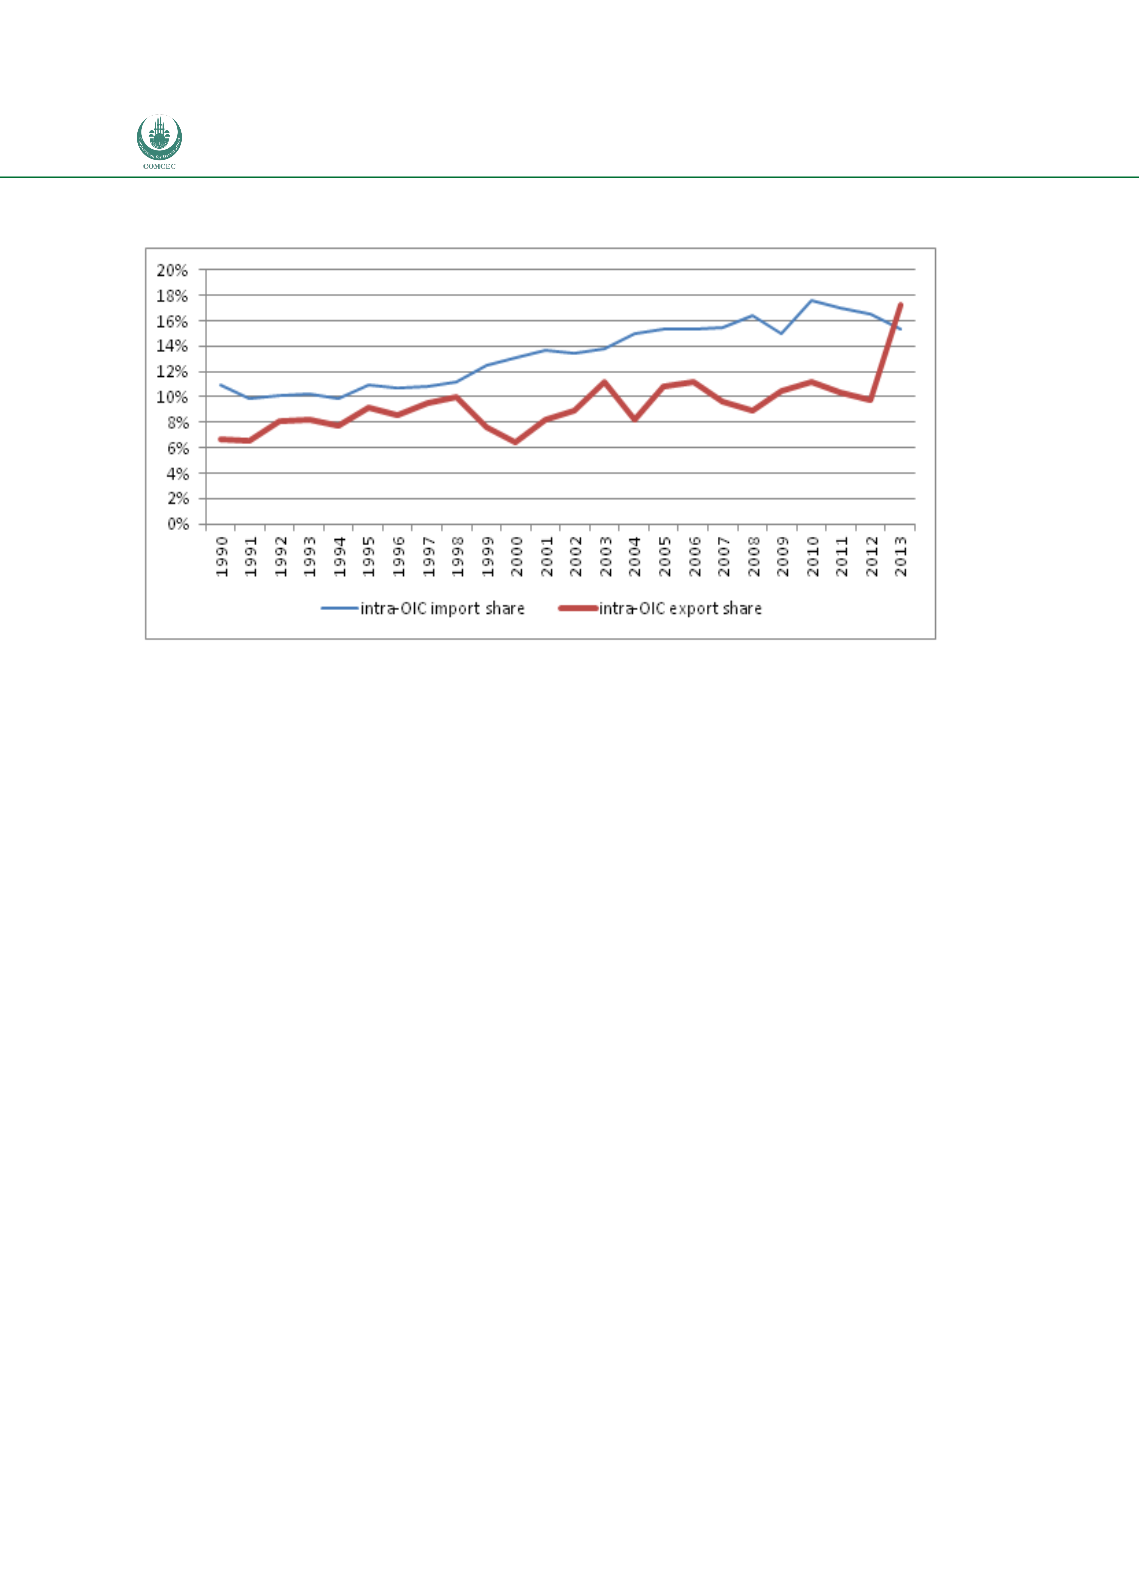
Figure 9:
Intra OIC Trade Shares, 1990-2013
Source: Comtrade data via WITS
In order to carry a more rigorous comparison of intra-OIC trade shares over time, i.e. with a
consistent group of reporting countries, we undertake two exercises. First, we take all those
countries that reported in both 1995 and 2010 and look at the change in shares over time for
each of these countries.20 First we compute the share for each country, and then the simple
average intra-OIC share for each of these years. Note that the partner "country" here is the OIC
grouping, so while we are holding the number of reporting countries that actually report their
trade constant, the number of partner countries which report their trade data in the OIC
grouping may change over time. So any change in the average intra-OIC trade share may arise
from changes in the share of trade with individual given countries; or may arise because trade
is now reported with additional countries with whom the share of OIC trade may be higher or
lower.
For the 21 countries which consistently report trade data for 1995 and 2010 we see that the
average share of intra-OIC total imports rose from 17.1% to 19.9%; and total non-oil and gas
imports rose from 14.5% to 16.7%. If the same exercise is carried out, but this time on the
countries for which data is available for 2000 and 2010 then the change in total imports was
from 17.8% to 20.1%; and for non-oil and gas imports the change was from 15.1% to 18%. If
we consider exports we see that the share of intra-OIC in total exports declined slightly from
20.7% to 19.9%. If we consider total non-oil and gas exports then the average change in
shares was again a small decline from 23.3% to 22.6%. If the same exercise is carried out, (the
countries included are: Algeria, Burkina Faso, Cameroon, Côte d’Ivoire, Egypt, Gambia,
Indonesia, Jordan, Kazakhstan, Kyrgyzstan, Malaysia, Maldives, Morocco, Mozambique, Niger,
Oman, Suriname, Togo, Tunisia, Turkey, Uganda) but this time on the countries which reported
in 2000 and 2010, we see an increase in the intra-OIC share of exports from 16.2% to 20.2%