


 100 / 236

Preferential Trade Agreements and Trade Liberalization Efforts in the OIC Member States
With Special Emphasis on the TPS-OIC
78
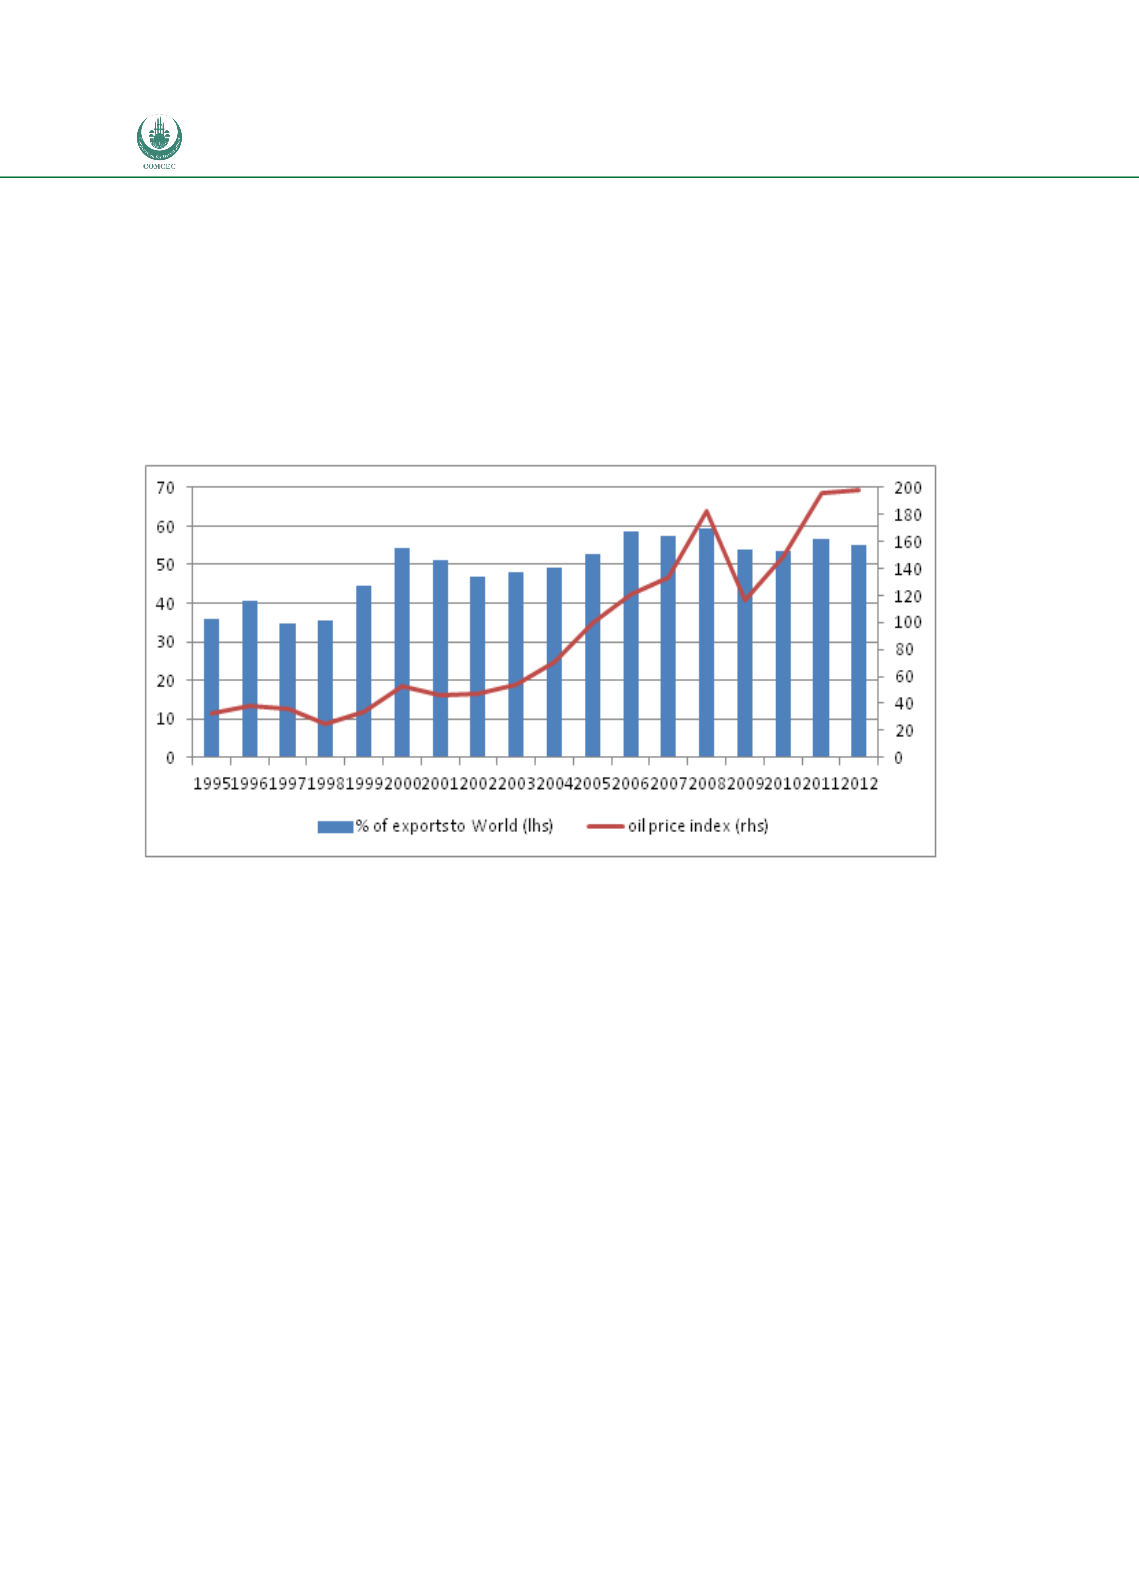
Especially in the list of the main OIC exporters we see that prominent among these are the
major global exporters of oil and gas. Indeed, mineral fuels (HS chapter 27) are by far the
dominant product group exported by OIC countries. Moreover, its share has increased from
around 40% of total OIC exports in late 1990s to the 50-60% range in more recent period. This
in large part owes to an increase in global oil prices from the lows in late 1990s to record high
values observed in recent years.
Figure 8: Share of Mineral fuels, Oils, Distillation Products (HS27) in OIC exports to World, 1995-
2012 plotted against international oil price index
Source: Comtrade data via WITS and IMF Primary Commodity Prices database.
Note: Oil price index used (scale on right hand axis) is Crude Oil (petroleum), Price Index,
2005=100, simple average of three spot prices; Dated Brent, West Texas Intermediate, and the Dubai
Fateh
Intra-OIC Trade Shares
Given the focus in this report on regional integration and its potential for the OIC states, it is
interesting to examine the evolution of the share of intra-OIC trade over time. If we look at all
the countries which report trade, we see that the share of intra-OIC total imports over time has
risen from 11% in 1990 to 16.6% in 2012 and 15.4% in 2013. Out of total OIC exports 6.7%
were destined for other OIC countries in 1990, and by 2012 this has risen to 9.8% (and 17.3%
in 2013). The increases are more pronounced when analysed for all "non-oil and gas"
products. Note however, that the number of countries reporting trade in 1990 is considerably
lower than in 2012 (23 and 33, respectively) and only 16 countries reported trade for 2013.
Thus, the numbers that are also plotted on Figure 9 below reflect both changes in the pattern
of trade and changes in the country composition and are therefore likely to be misleading.
Most reliable are figures for the period 1998-2010 when at least 41 OIC countries reported