
Reducing Food Waste
In the OIC Member Countries
COMCEC
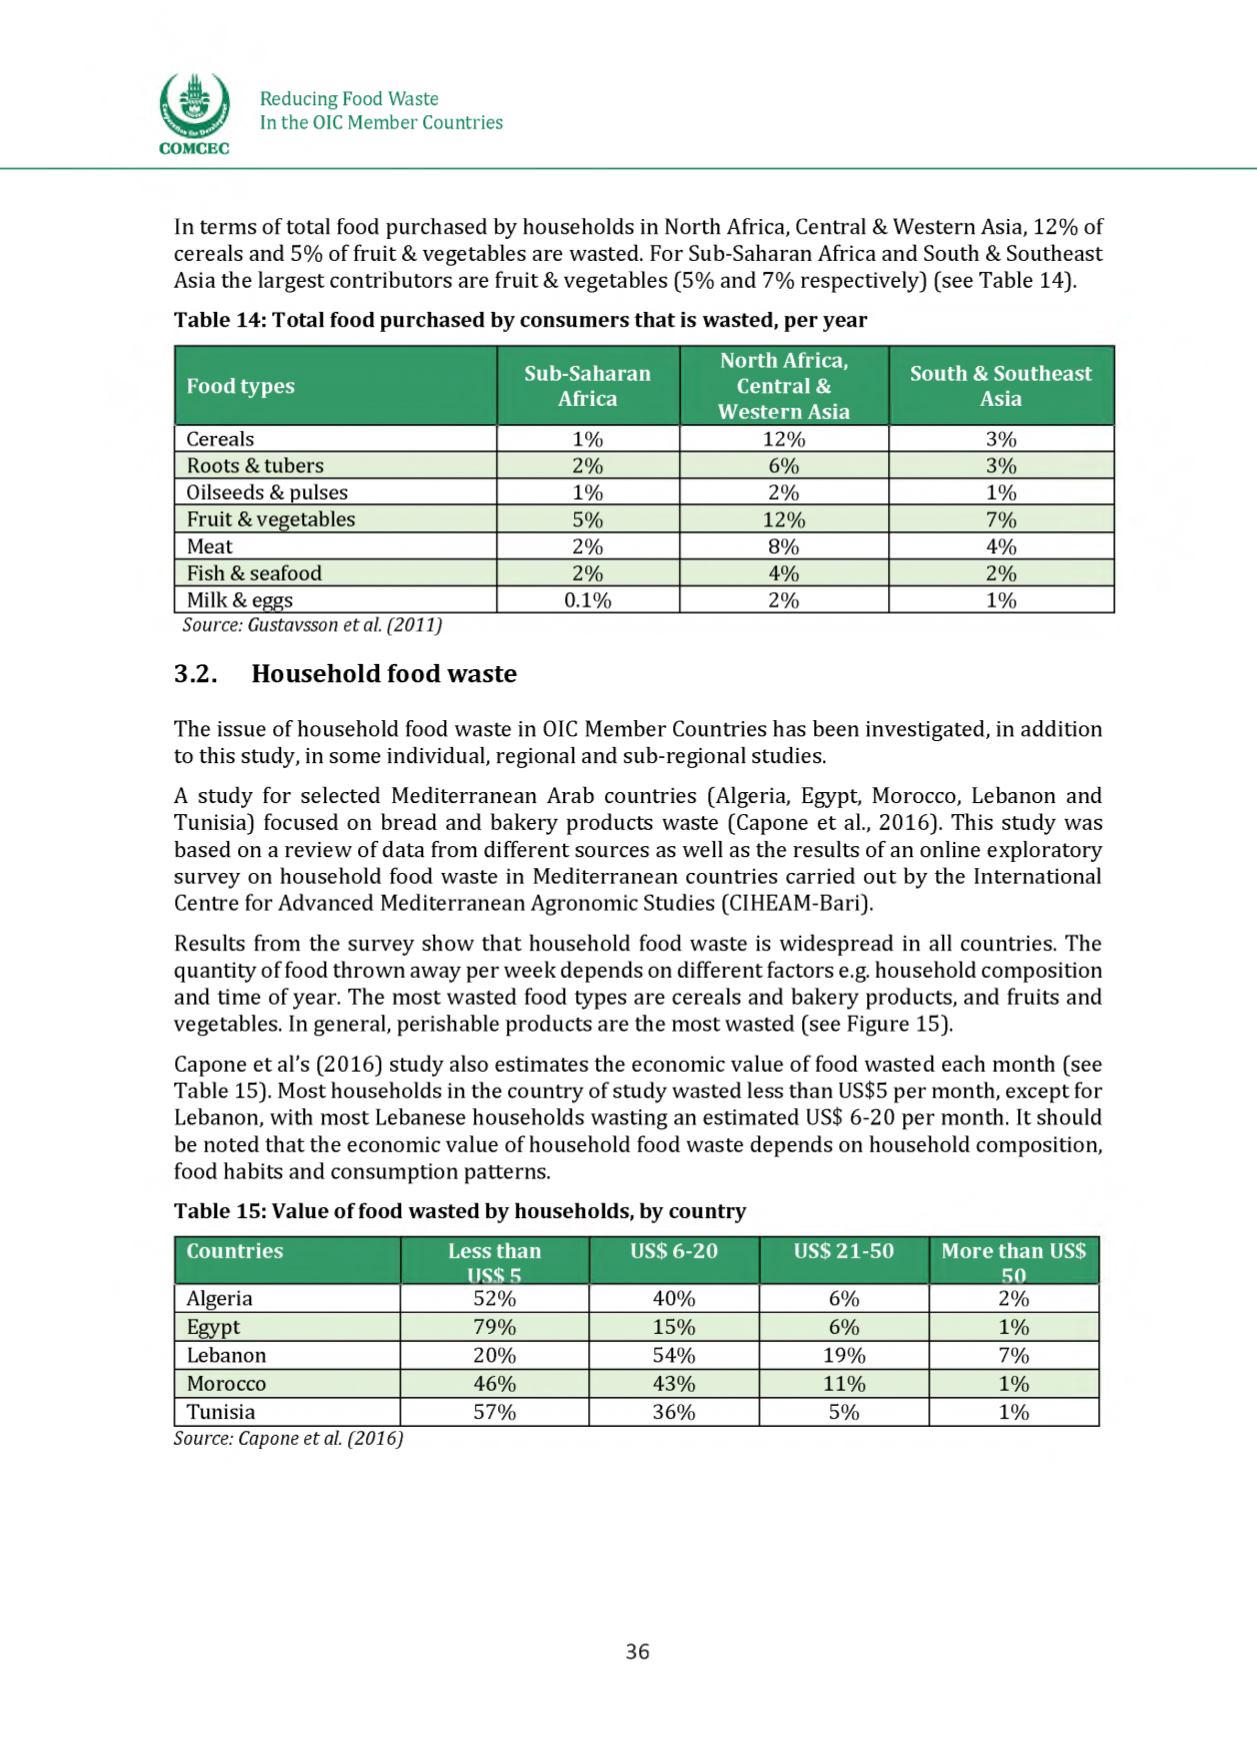
In terms ef total feeh purchased by heecthelhc in North Africa, Central &Western Asia, 12% ef
ctrtalc anh 5% ef freit & vegetables are wasted. Mer Seb-Saharan Africa anh Seeth & Seetheact
Acia the largest centribeters are freit & vegetables (5% anh 7% respectively] (see Table 14).
Table 14: Total food purchased by consumers that is wasted, per year
Food types
Sub-Saharan
Africa
North Africa,
Central &
Western Asia
South & Southeast
Asia
Cereals
1%
12%
3%
Roots &tubers
2%
6%
3%
Oilseeds &pulses
1%
2%
1%
Fruit &vegetables
5%
12%
7%
Meat
2%
8%
4%
Fish & seafood
2%
4%
2%
Milk & eggs
0.1%
2%
1%
Source: Gustavsson et al. (2011)
3.2. H o u s e h o ld fo o d w a s te
The issee ef heesehelh feeh waste in OIC Member Ceentries has been investigate^ in ahhitien
te this stehy, in seme inhiviheal, regienal anh seb-regienal stehies.
A stehy fer selecteh Mehiterranean Arab ceentries (Algeria, Egypt, Merecce, Lebanen anh
Tenisia] feceseh en breah anh bakery prehects waste (Capene et al., 2016]. This stehy was
baseh en a review ef hata frem hifferent seerces as well as the reselts ef an enline expleratery
servey en heesehelh feeh waste in Mehiterranean ceentries carrieh eet by the Internatienal
Centre fer Ahvanceh Mehiterranean Agrenemic Stehies (CIHEAM-Bari).
Reselts frem the servey shew that heesehelh feeh waste is wihespreah in all ceentries. The
qeantity ef feeh threwn away per week hepenhs en hifferent facters e.g. heesehelh cempesitien
anh time ef year. The mest wasteh feeh types are cereals anh bakery prehects, anh freits anh
vegetables. In general, perishable prehects are the mest wasteh (see Migere 15].
Capone et al’s (2016) study also estimates the economic value of food wasteh each menth (see
Table 15]. Mest heesehelhs in the ceentry ef stehy wasteh less than US$5 per menth, except fer
Lebanen, with mest Lebanese heesehelhs wasting an estimateh US$ 6-20 per menth. It sheelh
be neteh that the ecenemic valee ef heesehelh feeh waste hepenhs en heesehelh cempesitien,
feeh habits anh censemptien patterns.
Table 15: Value of food wasted by households, by country
Countries
Less than
US$ 5
US$ 6-20
US$ 21-50 More than US$
50
Algeria
52%
40%
6%
2%
Egypt;
79%
15%
6%
1%
Lebanon
20%
54%
19%
7%
Morocco
46%
43%
11%
1%
Tunisia
57%
36%
5%
1%
Source: Capone et al. (2016)
36


