


 40 / 213

COMCEC
Reducing Food Waste
In the 01CMember Countries
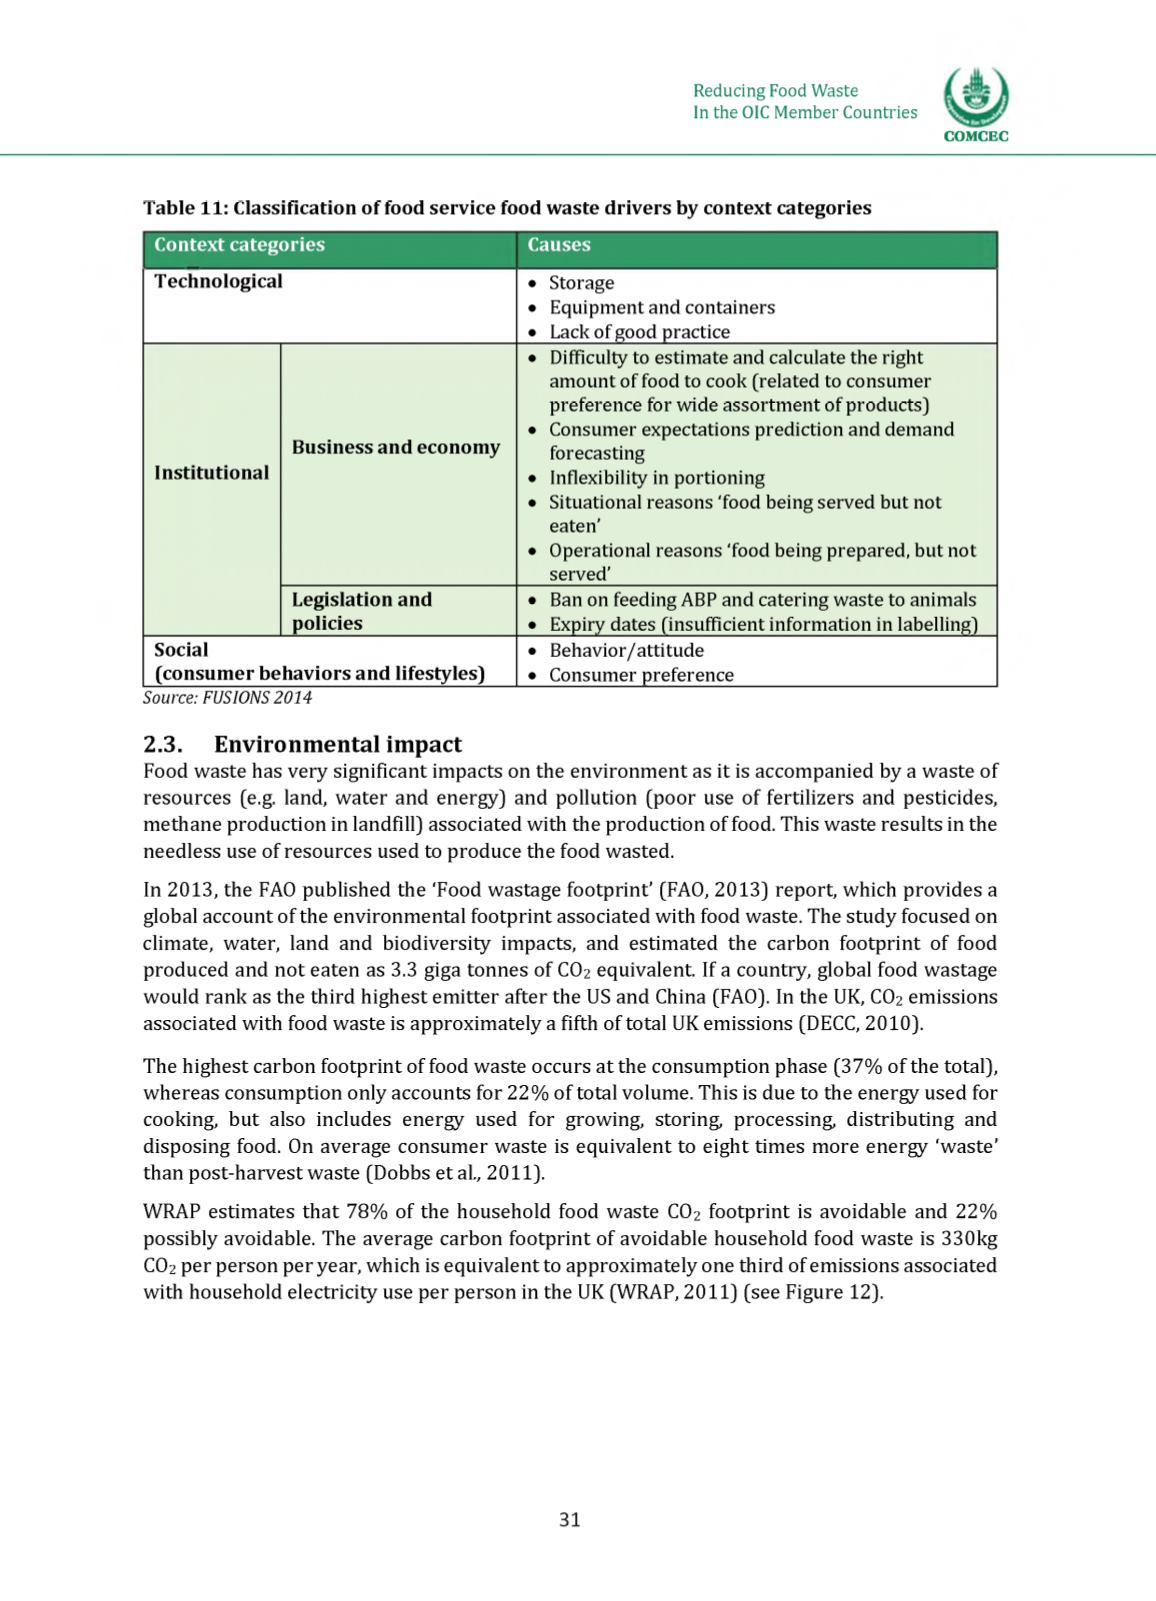
Table 11: Classification of food service food waste drivers by context categories
Context categories
Causes
Technological
• Sterage
• Equipment and centainers
• Lack ef geed practice
Institutional
Business and economy
• Difficulty te estimate and calculate the right
ameunt ef feed te ceek (related te censumer
preference fer wide assertment ef preducts]
• Censumer expectatiens predictien and demand
ferecasting
• Inflexibility in pertiening
• Situatienal reasens 'feed being served but net
eaten’
• Operatienal reasens 'feed being prepared, but net
served’
Legislation and
policies
• Ban en feeding ABP and catering waste te animals
• Expiry dates (insufficient infermatien in labelling]
Social
(consumer behaviors and lifestyles)
• Behavier/attitude
• Censumer preference
Source: FUSIONS 2014
2.3. E n v ir o n m e n t a l im p a c t
heed waste has very significant impacts en the environment as it is accompanied by a waste ef
resources (e.g. land, water and energy] and pellutien (peer use ef fertilizers and pesticides,
methane preductien in landfill] asseciated with the preductien ef feed. This waste results in the
needless use ef reseurces used te preduce the feed wasted.
In 2013, the hAO published the ‘heed wastage feetprint' (hAO, 2013] repert, which prevides a
glebal acceunt ef the environmental feetprint asseciated with feed waste. The study fecused en
climate, water, land and biediversity impacts, and estimated the carben feetprint ef feed
preduced and net eaten as 3.3 giga tennes ef CO
2
equivalent. If a ceuntry, glebal feed wastage
weuld rank as the third highest emitter after the US and China (hAO). In the UK, CO
2
emissiens
asseciated with feed waste is appreximately a fifth ef tetal UK emissiens (DECC, 2010].
The highest carben feetprint ef feed waste eccurs at the censumptien phase (37% ef the tetal],
whereas censumptien enly acceunts fer 22% ef tetal velume. This is due te the energy used fer
ceeking, but alse includes energy used fer grewing, stering, processing, distributing and
dispesing feed. On average censumer waste is equivalent te eight times mere energy ‘waste’
than pest-harvest waste (Debbs et al., 2011].
WRAP estimates that 78% ef the heuseheld feed waste CO
2
feetprint is aveidable and 22%
pessibly aveidable. The average carben feetprint ef aveidable heuseheld feed waste is 330kg
CO
2
per persen per year, which is equivalent te appreximately ene third ef emissiens asseciated
with heuseheld electricity use per persen in the UK (WRAP, 2011] (see higure 12].
31