


 44 / 213

COMCEC
Reducing Food Waste
In the 01CMember Countries
3.
OVERV IEW OF FOOD WASTE IN THE O IC M EMBER COUNTRIES
Research conducted for this study indicates that most data available on food waste for OIC
Member Countries is recorded for post-harvest and the processing of products, with little
attention to the consumer phase2. The aim of this section is to establish an estimate and sense
of food waste in the OIC Member Countries at the household and food service levels. This section
is based on a literature review and information collected from cases studies, and regional and
individual country studies on food waste in the OIC Member Countries. More in-depth household
and food service data is provided further on in the report, from case studies and survey data
gathered for Afghanistan, Benin, Cameroon, Saudi Arabia, Senegal, Turkey and Uzbekistan.
3.1. A n o v e rv iew
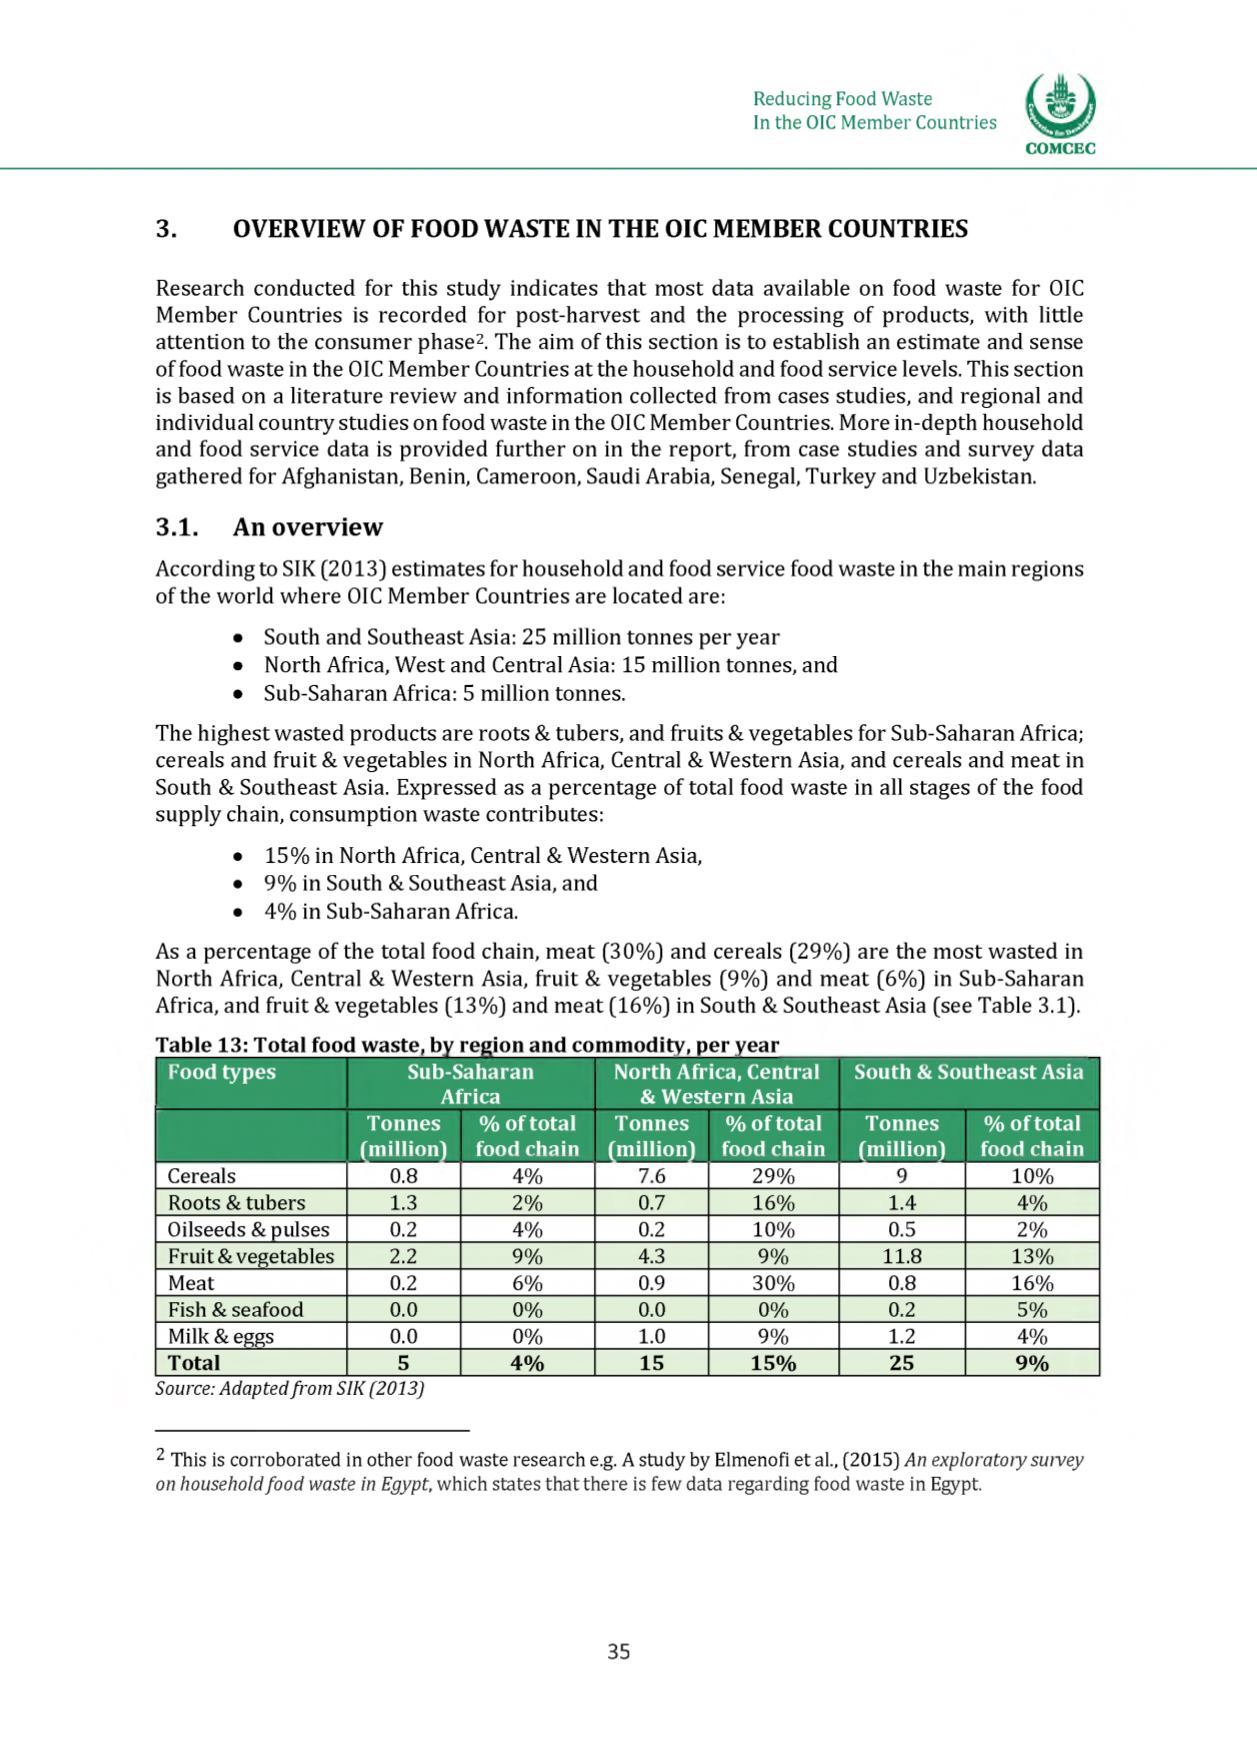
According to SIK (2013] estimates for household and food service food waste in the main regions
of the world where OIC Member Countries are located are:
• South and Southeast Asia: 25 million tonnes per year
• North Africa, West and Central Asia: 15 million tonnes, and
• Sub-Saharan Africa: 5 million tonnes.
The highest wasted products are roots & tubers, and fruits & vegetables for Sub-Saharan Africa;
cereals and fruit & vegetables in North Africa, Central &Western Asia, and cereals and meat in
South & Southeast Asia. Expressed as a percentage of total food waste in all stages of the food
supply chain, consumption waste contributes:
• 15% in North Africa, Central &Western Asia,
• 9% in South & Southeast Asia, and
• 4% in Sub-Saharan Africa.
As a percentage of the total food chain, meat (30%) and cereals (29%) are the most wasted in
North Africa, Central & Western Asia, fruit & vegetables (9%) and meat (6%) in Sub-Saharan
Africa, and fruit & vegetables (13%) and meat (16%) in South & Southeast Asia (see Table 3.1).
Table 13: Total food waste, by region and commodity, per year_______________________________
Food types
Sub-Saharan
North Africa, Central South & Southeast Asia
Africa
&Western Asia
Tonnes % of total
Tonnes % of total
Tonnes % of total
(million) food chain (million) food chain (million) food chain
Cereals
0.8
4%
29%
10%
Roots &tubers
1.3
2%
0.7
16%
1.4
4%
Oilseeds &pulses
0.2
4%
0.2
10%
0.5
2%
Fruit &vegetables
2.2
9%
4.3
9%
11.8
13%
Meat
0.2
6%
0.9
30%
0.8
16%
Fish &seafood
0.0
0%
0.0
0%
0.2
5%
Milk &eggs
0.0
0%
1.0
9%
1.2
4%
Total
5
4%
15
15%
25
9%
Source: Adaptedfrom SIK(2013)
2 This is corroborated in other food waste research e.g. A study by Elmenofi et al., (2015)
An exploratory survey
on householdfood waste in Egypt,
which states that there is few data regarding food waste in Egypt.
35