


 49 / 213

Reducing Food Waste
In the OIC Member Countries
COMCEC
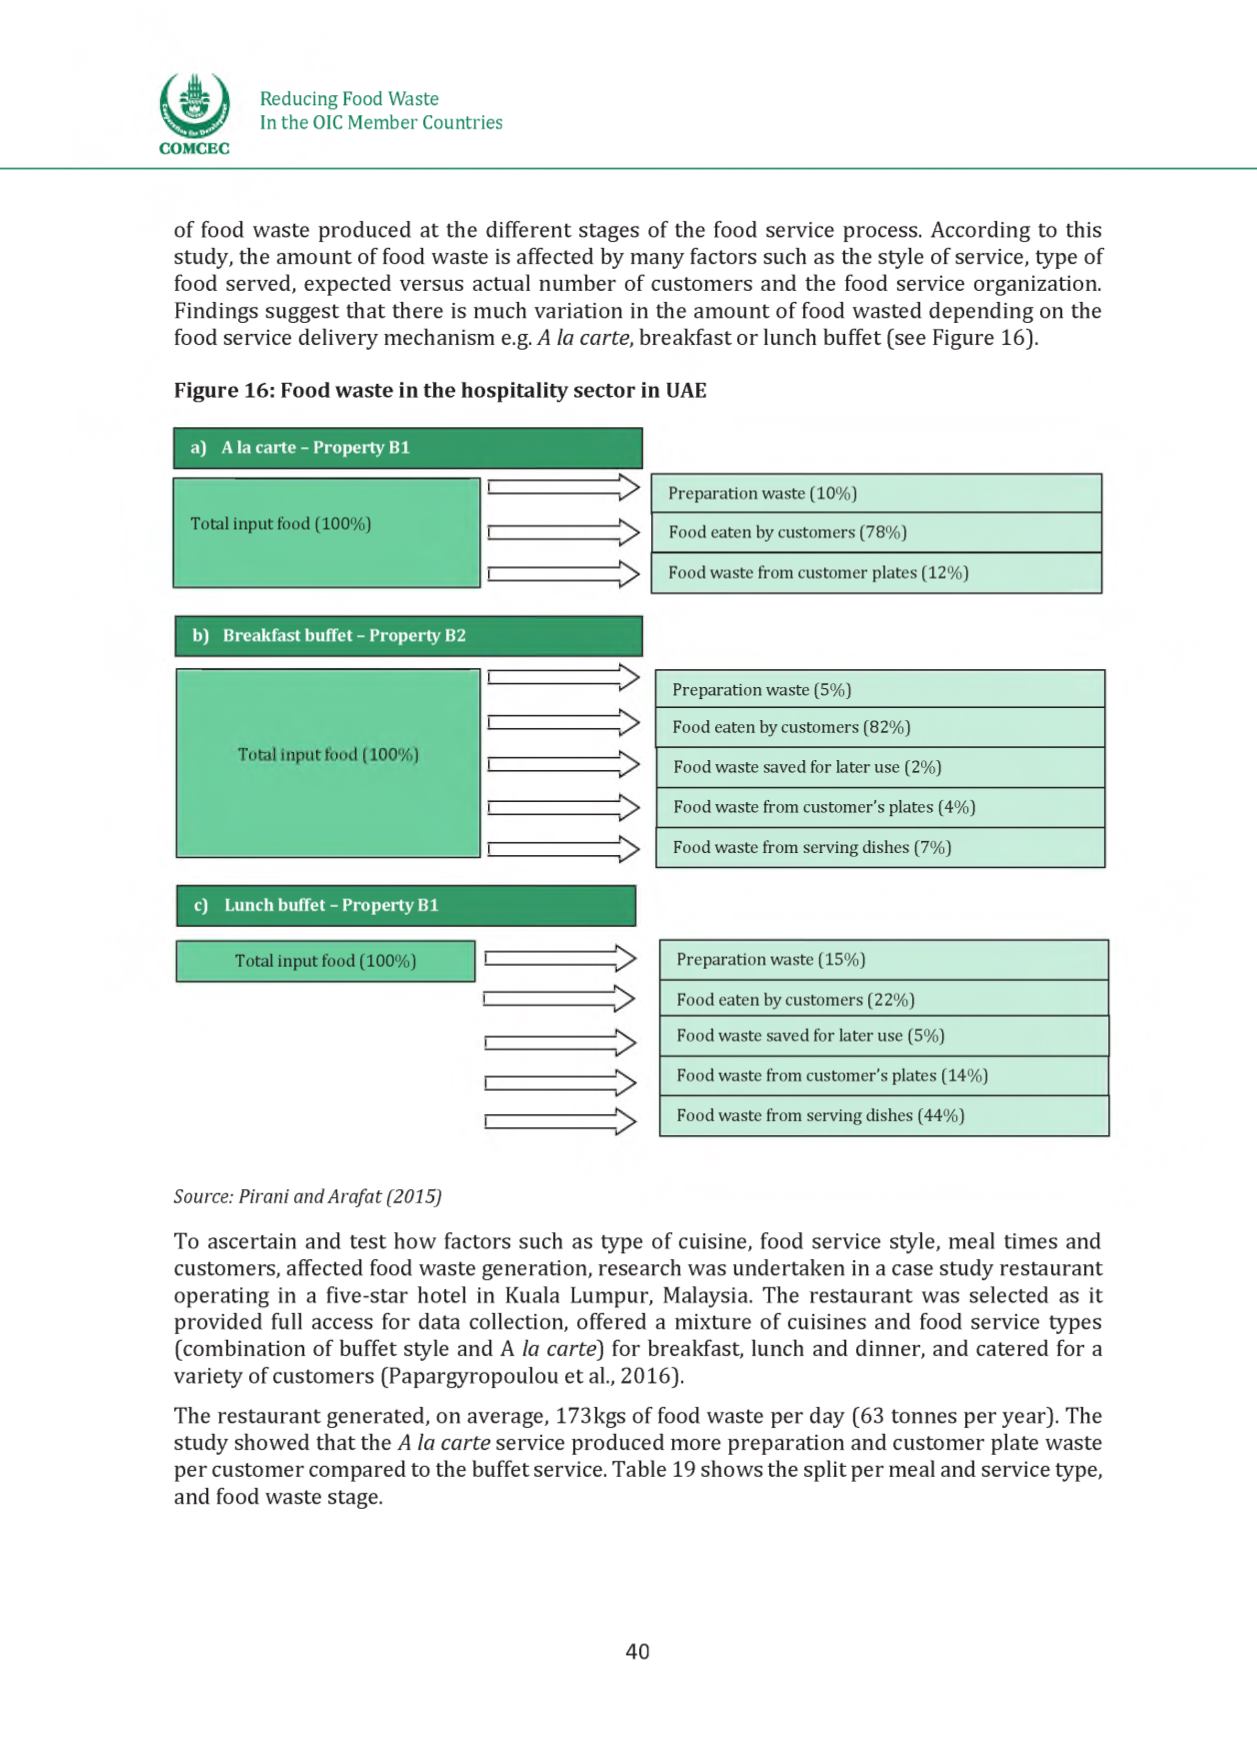
of food waste produced at the different stages of the food service process. According to this
study, the amount of food waste is affected by many factors such as the style of service, type of
food served, expected versus actual number of customers and the food service organization.
Findings suggest that there is much variation in the amount of food wasted depending on the
food service delivery mechanism e.g.
A la carte,
breakfast or lunch buffet (see Figure 16).
Figure 16: Food waste in the hospitality sector in UAE
a) A la carte - Property B1
Total input food (100%)
Preparation waste (10%)
Food eaten by customers (78%)
Food waste from customer plates (12%)
b) Breakfast buffet - Property B2
Preparation waste (5%)
Food eaten by customers (82%)
Food waste saved for later use (2%)
Food waste from customer's plates (4%)
Food waste from serving dishes (7%)
c) Lunch buffet - Property B1
Total input food (100%)
Preparation waste (15%)
Food eaten by customers (22%)
Food waste saved for later use (5%)
Food waste from customer's plates (14%)
Food waste from serving dishes (44%)
Source: Pirani andArafat (2015)
To ascertain and test how factors such as type of cuisine, food service style, meal times and
customers, affected food waste generation, research was undertaken in a case study restaurant
operating in a five-star hotel in Kuala Lumpur, Malaysia. The restaurant was selected as it
provided full access for data collection, offered a mixture of cuisines and food service types
(combination of buffet style and A
la carte
) for breakfast, lunch and dinner, and catered for a
variety of customers (Papargyropoulou et al., 2016).
The restaurant generated, on average, 173kgs of food waste per day (63 tonnes per year). The
study showed that the
A la carte
service produced more preparation and customer plate waste
per customer compared to the buffet service. Table 19 shows the split per meal and service type,
and food waste stage.
40